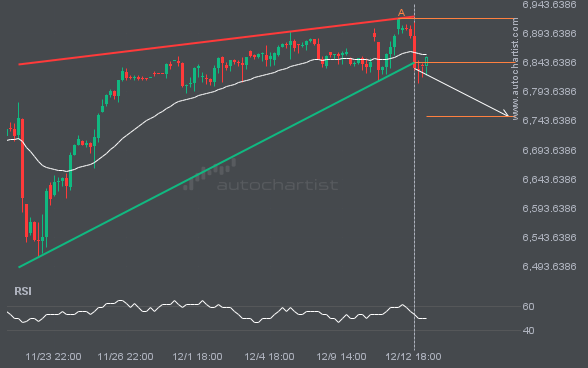
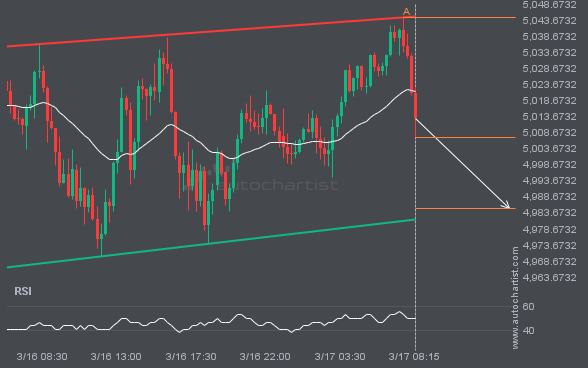
Rising Wedge pattern identified on S&P500 has broken through a support level, with price momentum continuing to move downward. This presents a solid trading opportunity, with the price expected to reach 6750.2777 in the next 3.
 Skip to content
 Rising Wedge pattern identified on S&P500 has broken through a support level, with price momentum continuing to move downward. This presents a solid trading opportunity, with the price expected to reach 6750.2777 in the next 3.
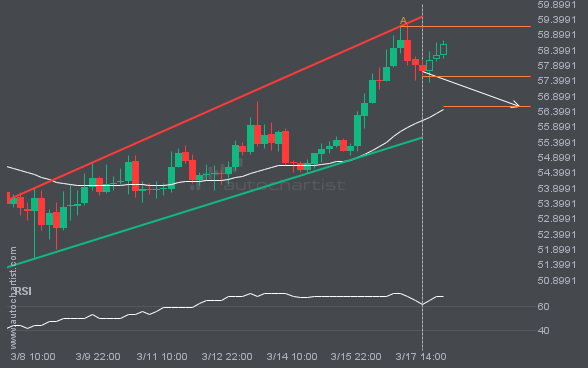
LTCUSD is moving toward a support line. Since it has retraced from this line before, we may see either a breakout through it or a rebound to current levels. It has touched this line multiple times in the past 13 days and may test it again within the next 3 days.
FTSE100 is moving toward a support line. Since it has retraced from this line before, we may see either a breakout through it or a rebound to current levels. It has touched this line multiple times in the past 6 days and may test it again within the next 9 hours.
BTCUSD: Significant movement recorded.
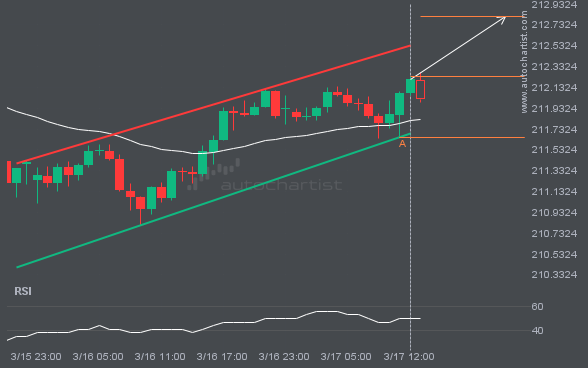
GBPJPY is heading toward the resistance line of a Channel Up pattern and could reach it within the next 10 hours. It has tested this line numerous times before, and this time may be no different, ending in a rebound instead of a breakout. If a breakout doesn’t occur, we could see a retracement back […]
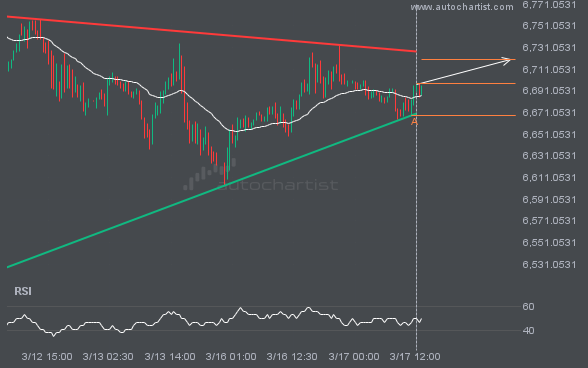
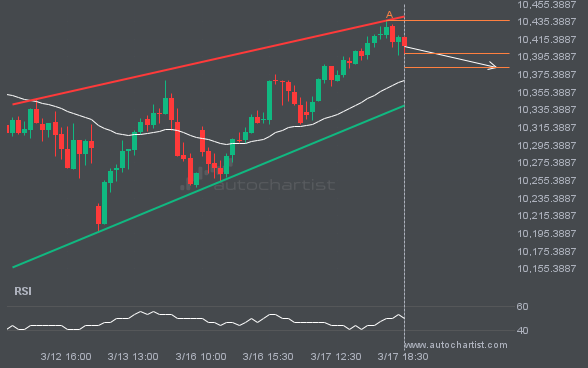
An emerging Triangle pattern in its final wave has been identified on the S&P500 30 Minutes chart. After a strong bullish run, S&P500 is heading toward the upper triangle trendline, with possible resistance at 6719.5129. If the resistance holds, the Triangle pattern suggests a rebound toward current levels.
The movement of XAUUSD toward the support line of a Channel Up is yet another test of the line it has reached numerous times in the past. This test of the line could occur within the next 8 hours, but it is uncertain whether it will result in a breakout through this line or simply […]
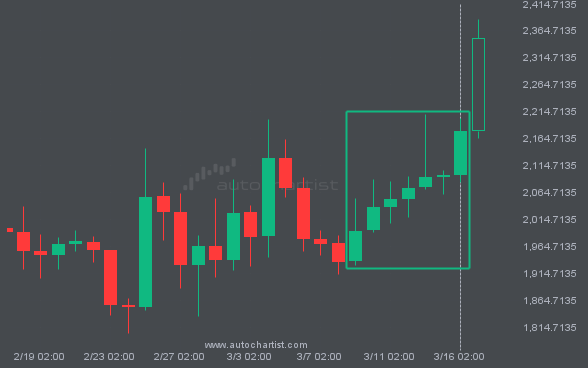
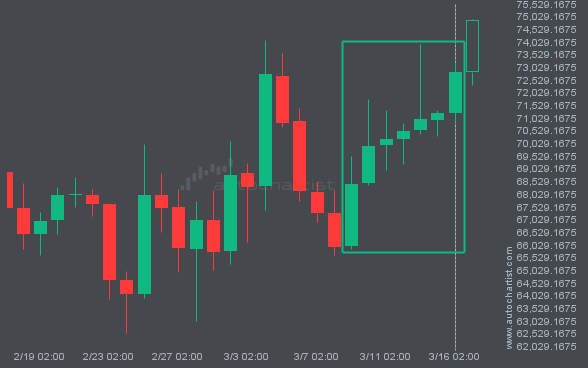
ETHUSD showed a long streak of consecutive bullish candles on the Daily chart.