Autochartist General
MARKET ANALYSIS

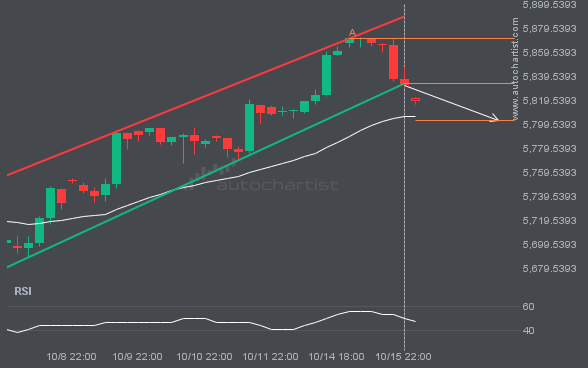
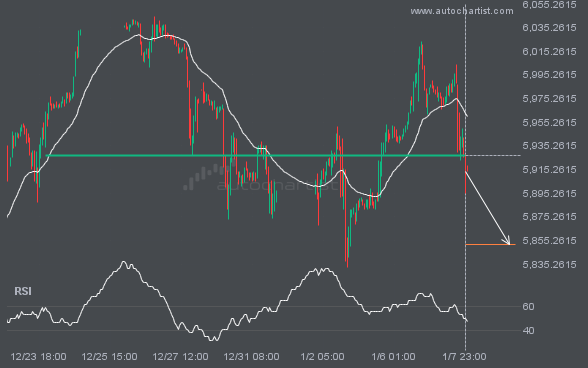
S&P500 has broken through the support line of a Channel Up technical chart pattern. Because we have seen it retrace from this line in the past, one should wait for confirmation of the breakout before taking any action. It has touched this line twice in the last 12 days and suggests a possible target level to be around 5802.8047 within the next 2 days.

XAUUSD is moving towards a key resistance level at 2654.0200. This is a previously tested level for XAUUSD. This could

ETHUSD is once again retesting a key horizontal support level at 2389.8601. It has tested this level 5 times in

BRN/USD is approaching a resistance line at 80.3550. If it hits the resistance line, it may break through this level

GBPJPY is approaching the resistance line of a Rising Wedge. It has touched this line numerous times in the last

S&P500 has breached the resistance line at 5772.2700. It may continue the bullish trend towards 5818.0278, or, it may prove

BTCUSD is moving towards a resistance line. Because we have seen it retrace from this line before, we could see

FTSE100 is en route to a very important line that will be a definite deciding factor of what is to