Autochartist's Technical Analysis deciphers historical data to uncover potential price movements.
Autochartist's Macroeconomic Analysis delves into the broader economic landscape.
Autochartist's Statistical Analysis uses historical and quantitative data to present possible market shifts.
Autochartist's Fundamental Analysis presents a holistic view of assets to determine intrinsic value.
Autochartist's Volatility Analysis offers insights into real-time market fluctuations based on historical data.
Autochartist's Sentiment Analysis taps into the market's pulse to measure optimism and pessimism in the market.
A powerful trading tool that scans the global financial markets providing near real-time, accurate, & detailed market insights.
Take your trading to the next level, no matter where you are, with “Our Favourites” on your mobile phone.
A dynamic component designed for traders who prefer to focus on a smaller selection of high-probability trade setups.
An advanced EA tool that brings market insights directly into your favourite trading platform.
A detailed economic calendar that keeps you at the forefront of high-impact market-moving events.
Our risk calculator helps you control your exposure and set appropriate position sizes.
Delivers a comprehensive view of market moods by analysing news sentiment across major, trusted financial news sources.
Provide insight into the levels of optimism or pessimism towards specific markets that impact market trends.
A comprehensive tool providing expected trading ranges for all instruments over the next 1 hour, 4 hours, and 24 hours.
A unique Economic calendar with detailed historical trend analysis.
Get all our analytics through Email, SMS, Push Notifications, Telegram, WhatsApp, LINE, etc. Available in 28+ languages.
A convenient hub for trending articles on stocks, impactful Forex economic news, and general financial market updates
Stay connected with traders using Autochartist's versatile messaging services, offering daily insights and high-probability trading opportunities.
Save time and effort while creating customised journeys and targeted marketing campaigns with Content Snippets.
Boost your brand's presence effortlessly with Autochartist's automated social media content.
Empower your sales team with insightful emails from Autochartist, blending expert market knowledge with engaging talking points to inspire and convert potential traders.
Elevate your broker website's appeal and SEO with Autochartist's dynamic trader-centric content.
Provides traders with a dynamic browsing experience for immediate access to valuable data, insights, and analyssi inside MetaTrader.
Revitalise your client portal with Autochartist's web components, delivering daily trading opportunities and weekly highlights.
The Autochartist Research Portal presents a transformative delivery system to seamlessly channel Autochartist's entire suite of tools and products.
Get all our analytics through Email.
Create your ideal broker site or trading platform with various integration choices to suit your business objectives and budget.
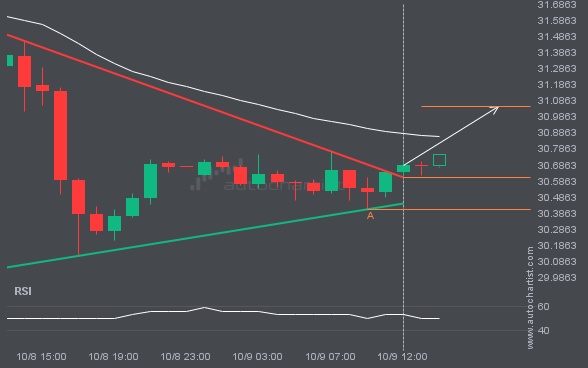
Home » Blog » Resistance line breached by XAGUSD. This price has been tested at least twice before.
The last 2 1 hour candles on XAGUSD formed a Triangle pattern and broken out through the pattern lines, indicating a possible bullish movement towards the price level of 31.0499.
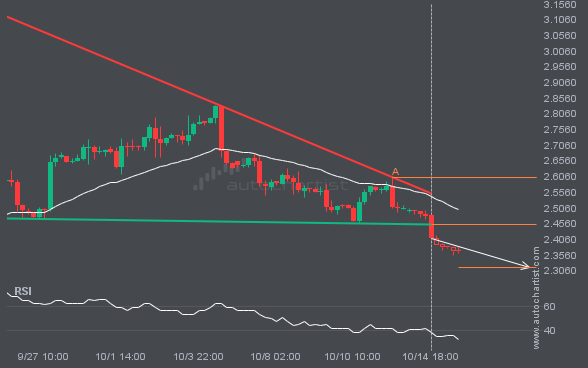
NGC/USD has broken through a support line. It has touched this line at least twice in the last 21 days.
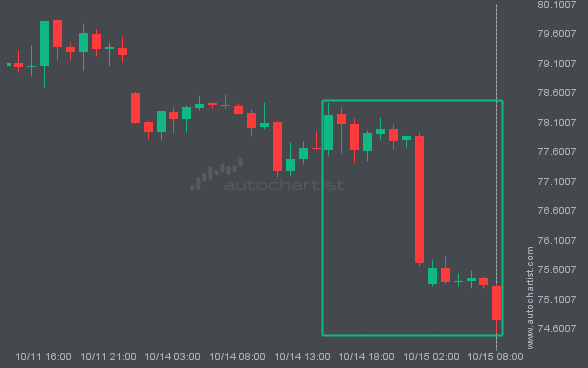
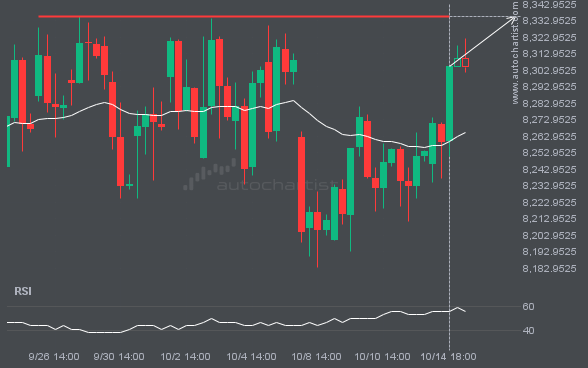
BRN/USD experienced an extremely large move that lasted 17. This movement is in the 5.0 percentile and is uncommon. It
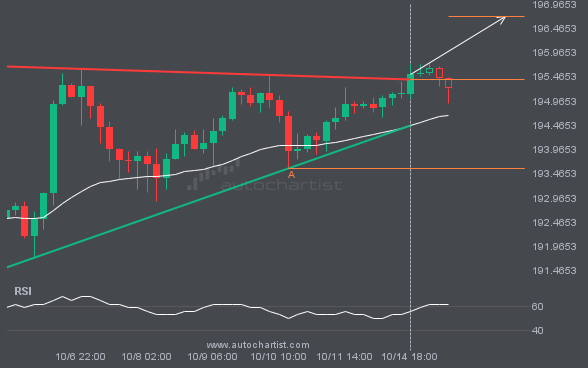
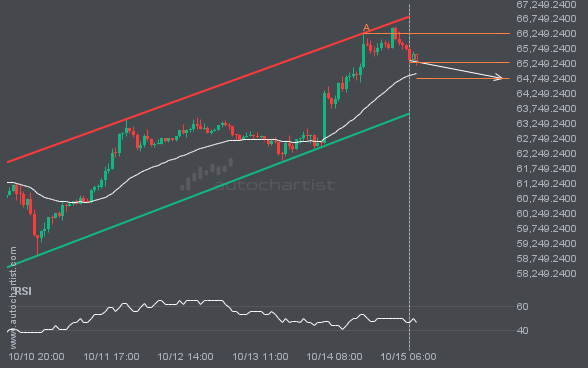
GBPJPY has broken through the resistance line of a Ascending Triangle technical chart pattern. Because we have seen it retrace
BTCUSD is moving towards a support line. Because we have seen it retrace from this line before, we could see
The price of FTSE100 in heading back to the resistance area. It is possible that it will struggle to break
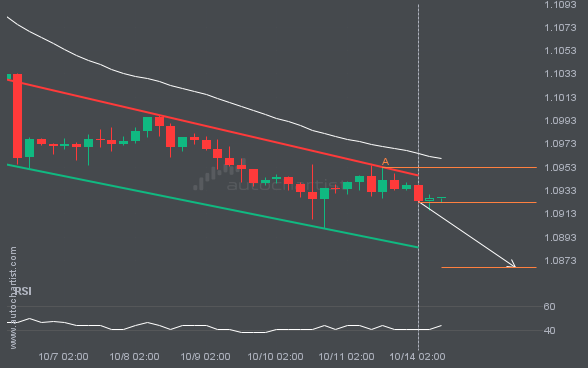
An emerging Channel Down has been detected on EURUSD on the 4 hour chart. There is a possible move towards
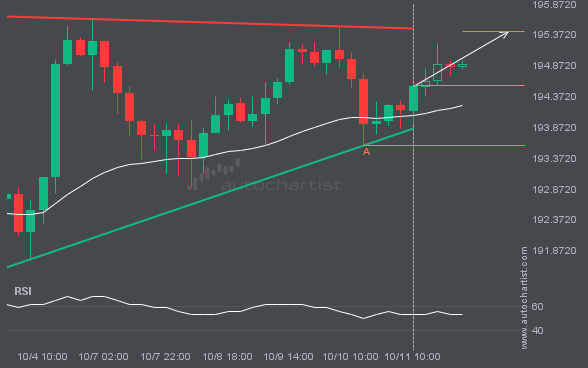
An emerging Ascending Triangle has been detected on GBPJPY on the 4 hour chart. There is a possible move towards