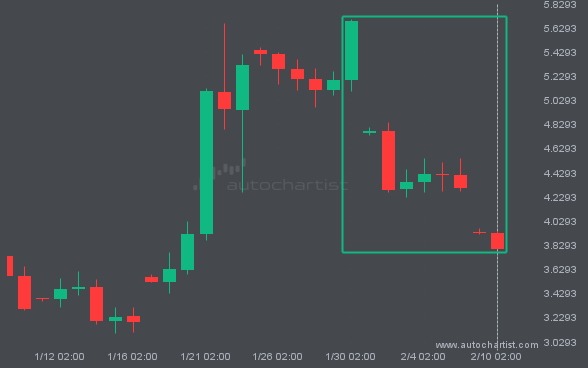
NGC/USD has moved lower by 33.27% from 5.686 to 3.7945 in the last 12 days.
 Skip to content
 NGC/USD has moved lower by 33.27% from 5.686 to 3.7945 in the last 12 days.
The movement of XAGUSD toward the support line of a Channel Up is yet another test of the line it has reached numerous times in the past. This test of the line could occur within the next 2 days, but it is uncertain whether it will result in a breakout through this line or simply […]
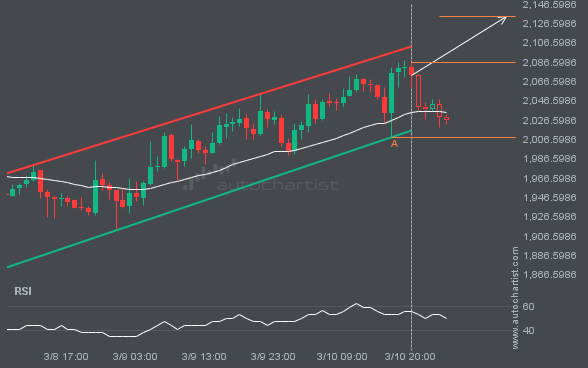
The movement of ETHUSD toward the resistance line of a Channel Up is yet another test of the line it has reached numerous times in the past. This test of the line could occur within the next 13 hours, but it is uncertain whether it will result in a breakout through this line or simply […]
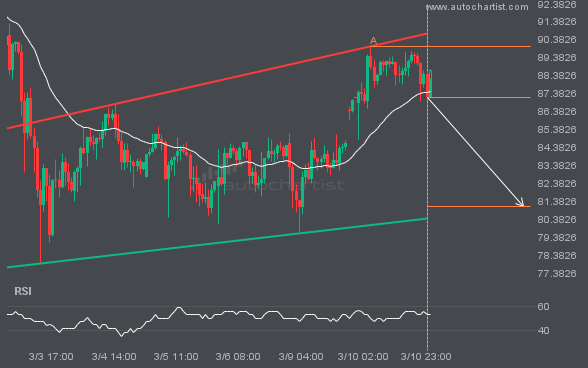
GBPJPY is moving toward a resistance line. Since it has retraced from this line before, we may see either a breakout through it or a rebound to current levels. It has touched this line multiple times in the past 4 days and may test it again within the next 7 hours.
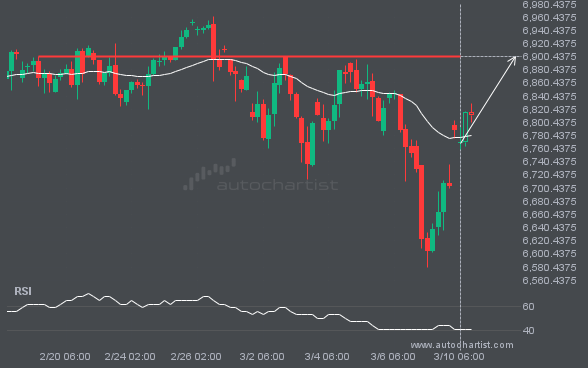
S&P500 is heading toward 6901.0801 and could reach this level within the next 3 days. It has tested this level numerous times in the past, and this time could be no different, ending in a rebound rather than a breakout. If a breakout does not occur, we may see a retracement back to current levels.

BRN/USD just posted a 60.55% move over the past 21 days—a move unlikely to go unnoticed by any trading style.

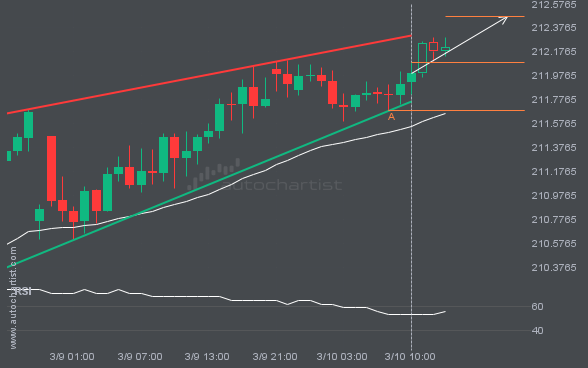
A breakout of EURUSD through the resistance line of a Falling Wedge could signal what’s ahead. If the breakout persists, we may see EURUSD’s price test 1.1662 within the next 2 days.

An emerging Channel Down has been detected on FTSE100. The pattern has not yet broken through support, but the price is expected to move up over the next few hours. At the time the pattern was found, the price was 10209.23, and it is expected to move to 10281.8381.