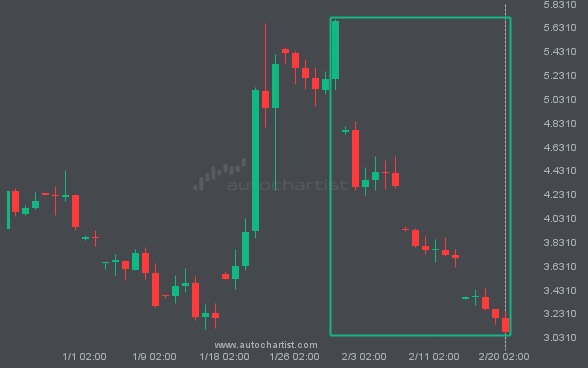
NGC/USD has moved lower by 45.95% from 5.686 to 3.0735 in the last 22 days.
 Skip to content
 NGC/USD has moved lower by 45.95% from 5.686 to 3.0735 in the last 22 days.
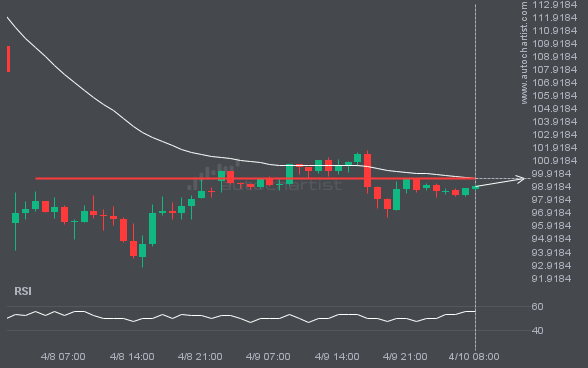
BRN/USD is moving toward a level at 99.5720, which it has tested many times before. We have seen it retrace from this level before, so at this stage it isn’t clear whether it will break through this price or rebound again. If BRN/USD continues on its current trajectory, we may see it move toward 99.5720 […]
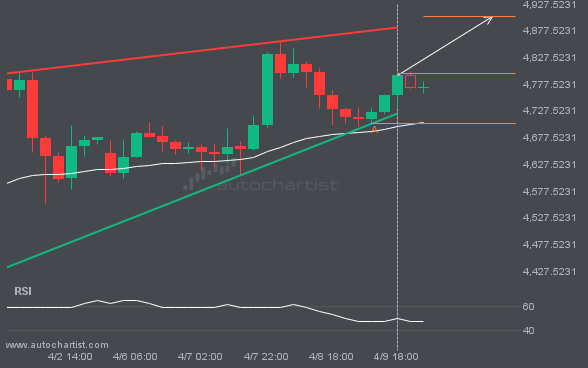
XAUUSD is trapped in a Rising Wedge formation, implying that a breakout is imminent. This is a strong trade setup for both trend and swing traders. It is now approaching a support line that has been tested before. Divergence watchers may be optimistic about a potential breakout, which could mark the start of a new […]
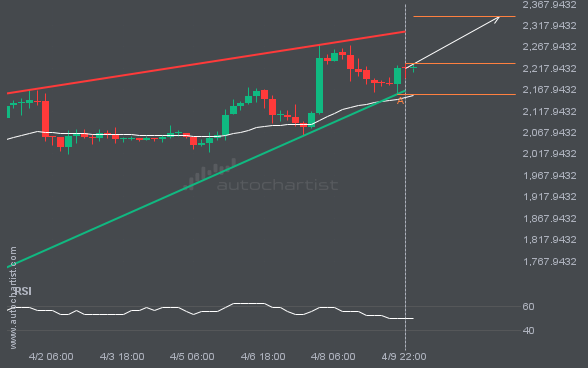
ETHUSD is moving toward a resistance line. Since it has retraced from this line before, we may see either a breakout through this line or a rebound to current levels. It has touched this line numerous times in the last 12 days and may test it again within the next 3 days.
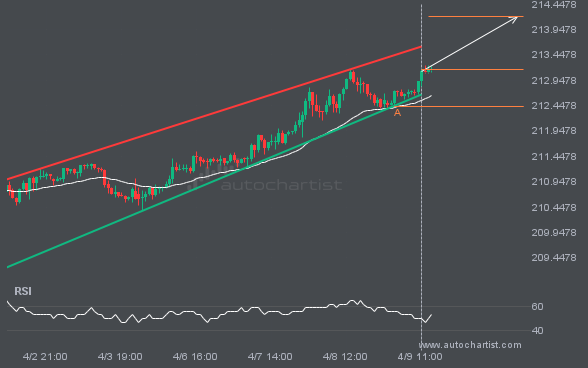
An emerging Channel Up pattern in its final wave has been identified on the GBPJPY 1 hour chart. After a strong bullish run, GBPJPY is heading toward the upper triangle trendline, with possible resistance at 214.2007. If the resistance holds, the Channel Up pattern suggests a rebound toward current levels.
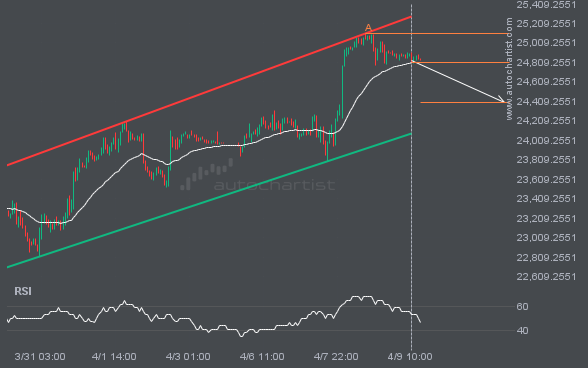
NAS100 is heading toward the support line of a Channel Up pattern and could reach it within the next 3 days. It has tested this line numerous times before, and this time may be no different, ending in a rebound instead of a breakout. If a breakout doesn’t occur, we could see a retracement back […]
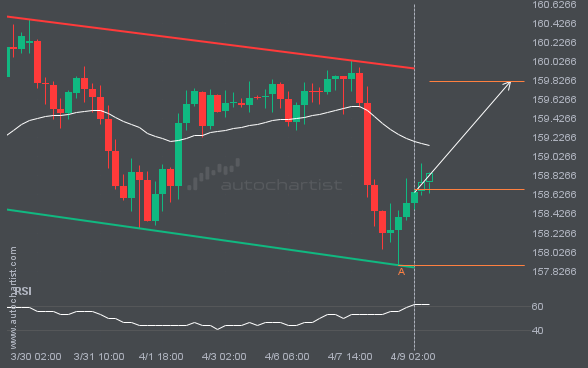
A Channel Down pattern was identified for USDJPY at 158.6825, suggesting it may move toward the resistance line at 159.8174. It may break through that line and continue the bullish trend, or reverse from it.
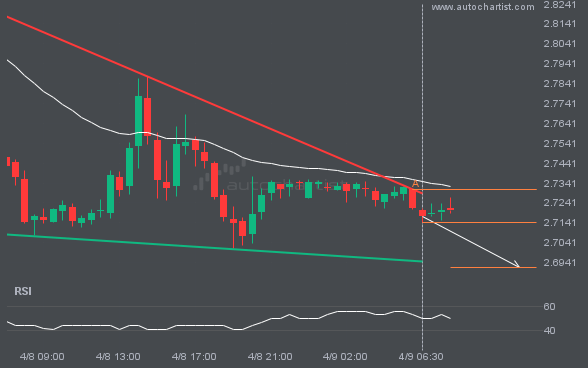
NGC/USD was identified around 2.714 after recently rebounding off the resistance on the 30 Minutes interval. Ultimately, the stock’s price action has formed a Falling Wedge pattern. This squeeze may increase the chances of a strong breakout. The projected move could take the price to around 2.6916.