...
MARKET ANALYSIS

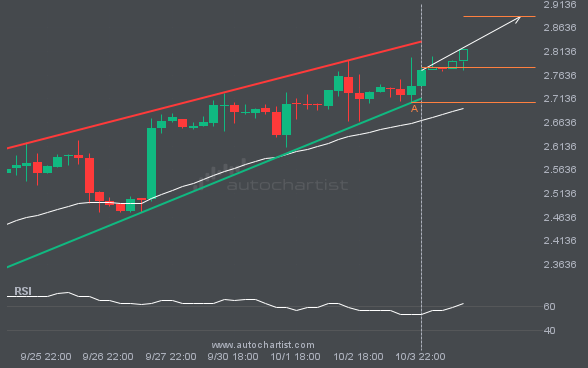
Emerging Rising Wedge detected on NGC/USD – the pattern is an emerging one and has not yet broken through support, but the price is expected to move up over the next few hours. The price at the time the pattern was found was 2.78 and it is expected to move to 2.8871.

S&P500 is moving toward a resistance line. Since it has retraced from this line before, we may see either a breakout through it or a rebound to current levels. It has touched this line multiple times in the past 15 days and may test it again within the next 3 days.

XAGUSD is approaching the line at 51.3712. If this move continues, the price of XAGUSD could test 51.3712 within the next 2 days. But do not rush to trade. It has tested this line many times in the past, so the move could be short-lived and end in a rebound.

EURUSD is moving toward a level at 1.1542, which it has tested many times before. We have seen it retrace from this level before, so at this stage it isn’t clear whether it will break through this price or rebound again. If EURUSD continues on its current trajectory, we may see it move toward 1.1542 […]

LTCUSD has broken through a resistance line of the Falling Wedge chart pattern. If this breakout holds, we may see the price of LTCUSD test 86.8634 within the next 3 days. But don’t rush to trade. It has tested this line before, so confirm the breakout before taking any action.

NGC/USD is approaching a critical level that could be a key deciding factor for what comes next. We may see this trajectory continue to test and break through 4.4425, unless it loses momentum and pulls back to current levels.

FTSE100 is trapped in a Channel Down formation, implying that a breakout is imminent. This is a strong trade setup for both trend and swing traders. It is now approaching a resistance line that has been tested before. Divergence watchers may be optimistic about a potential breakout, which could mark the start of a new […]

BTCUSD was identified around 85501.04 after recently rebounding off the resistance on the 30 Minutes interval. Ultimately, the stock’s price action has formed a Falling Wedge pattern. This squeeze may increase the chances of a strong breakout. The projected move could take the price to around 84241.2217.