Autochartist General
MARKET ANALYSIS

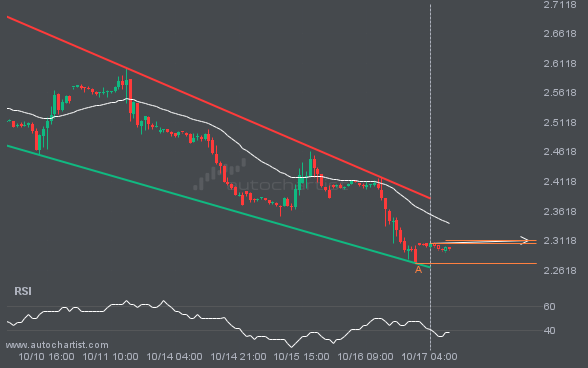
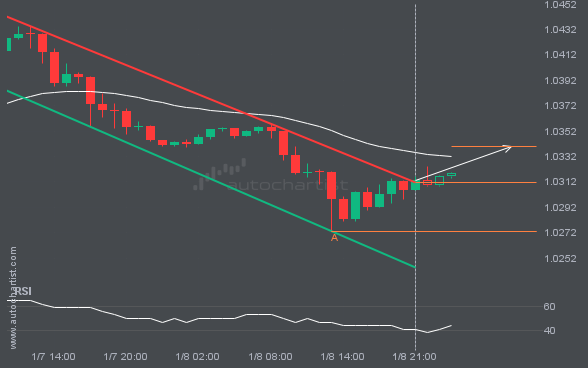
NGC/USD is heading towards the resistance line of a Falling Wedge. If this movement continues, the price of NGC/USD could test 2.3124 within the next 2 days. It has tested this line numerous times in the past, so this movement could be short-lived and end up rebounding just like it did in the past.

FTSE100 is trapped in a Channel Up formation, implying that a breakout is Imminent. This is a great trade-setup for

NAS100 is heading towards the resistance line of a Triangle and could reach this point within the next 2 days.

BTCUSD is moving towards a resistance line which it has tested numerous times in the past. We have seen it

EURUSD has experienced an exceptionally large amount of consecutive bearish candles to reach a price of 1.0859 in the last

Emerging Channel Up detected on FTSE100 – the pattern is an emerging one and has not yet broken through resistance,

LTCUSD is moving towards a resistance line. Because we have seen it retrace from this line before, we could see