MARKET ANALYSIS

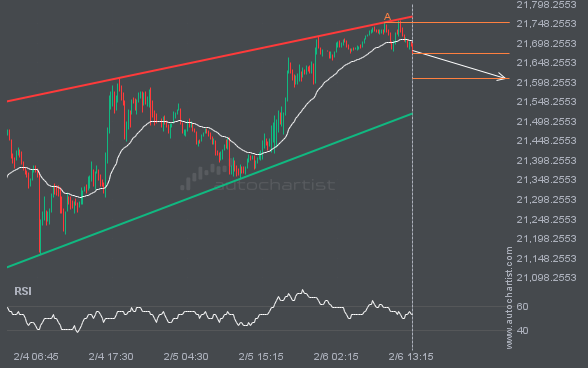
NAS100 is heading towards the support line of a Rising Wedge. If this movement continues, the price of NAS100 could test 21608.6332 within the next 17 hours. It has tested this line numerous times in the past, so this movement could be short-lived and end up rebounding just like it did in the past.

Ascending Triangle pattern identified on LTCUSD has broken through a resistance level, with price momentum continuing to move upward. This presents a solid trading opportunity, with the price expected to reach 57.3057 in the next 23.

S&P500 is moving toward a level at 6912.7402, which it has tested many times before. We have seen it retrace from this level before, so at this stage it isn’t clear whether it will break through this price or rebound again. If S&P500 continues on its current trajectory, we may see it move toward 6912.7402 […]

USDJPY has broken through a support line. Because it has previously retraced from this price, you should wait for confirmation of the breakout before trading. It has touched this line multiple times over the past 2 days, which suggests a possible target around 156.7770 within the next 7 hours.

EURUSD has broken through the resistance line, which it has tested twice before. We have seen it retrace from this line before, so wait for confirmation of the breakout before trading. If this new trend persists, a target level around 1.1654 may materialize within the next 6 hours.

The movement of NAS100 toward the support line of a Falling Wedge is yet another test of the line it has reached numerous times in the past. This test of the line could occur within the next 2 days, but it is uncertain whether it will result in a breakout through this line or simply […]

BRN/USD is moving toward a resistance line. Since it has retraced from this line before, we may see either a breakout through this line or a rebound to current levels. It has touched this line numerous times in the last 9 days and may test it again within the next 2 days.

S&P500 was identified around 6833.78 after recently rebounding off the resistance on the 1 hour interval. Ultimately, the stock’s price action has formed a Falling Wedge pattern. This squeeze may increase the chances of a strong breakout. The projected move could take the price to around 6729.9590.