Autochartist General
MARKET ANALYSIS

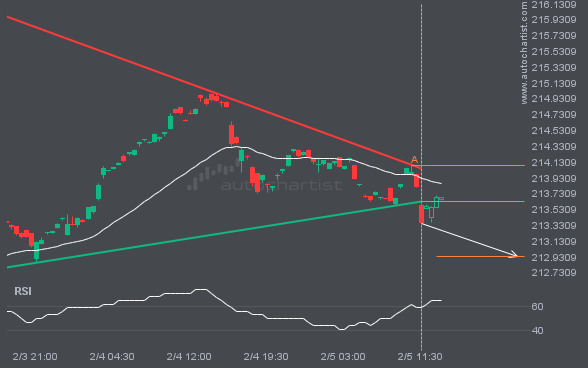
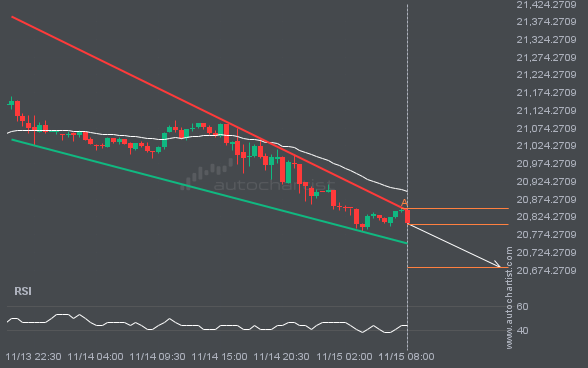
NAS100 is heading towards the support line of a Falling Wedge. If this movement continues, the price of NAS100 could test 20681.9942 within the next 10 hours. It has tested this line numerous times in the past, so this movement could be short-lived and end up rebounding just like it did in the past.
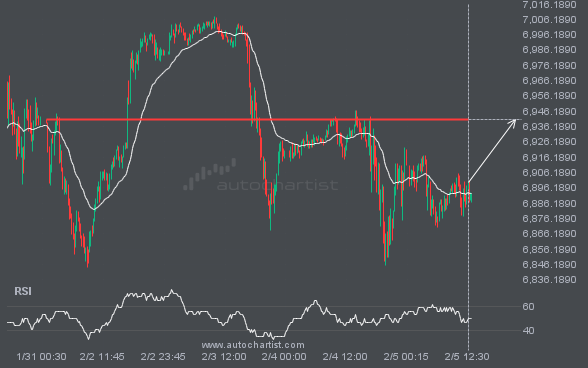
BTCUSD has broken through a line of 86996.5234. If this breakout holds true, we could see the price of BTCUSD

Trend followers are probably eagerly watching FTSE100 to see if its latest 4 consecutive candles continues. If not, the mean-reversion

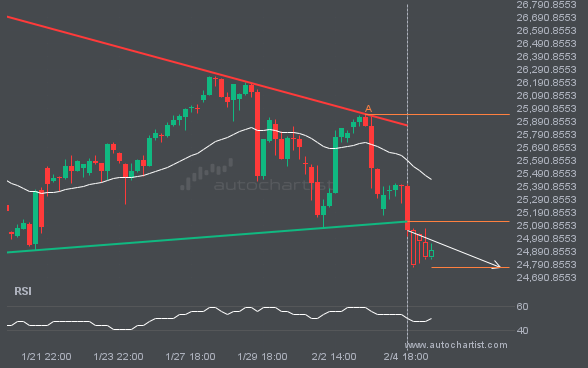
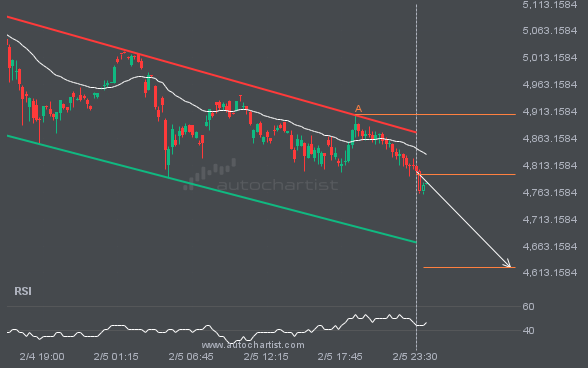
Emerging Falling Wedge pattern in its final wave was identified on the S&P500 15 Minutes chart. After a strong bearish

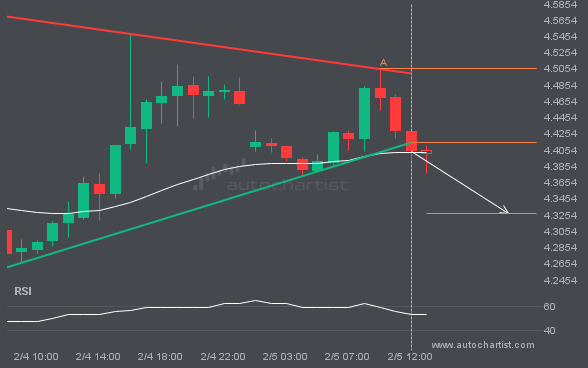
A Falling Wedge pattern was identified on XAGUSD at 30.199, creating an expectation that it may move to the support