Skip to content
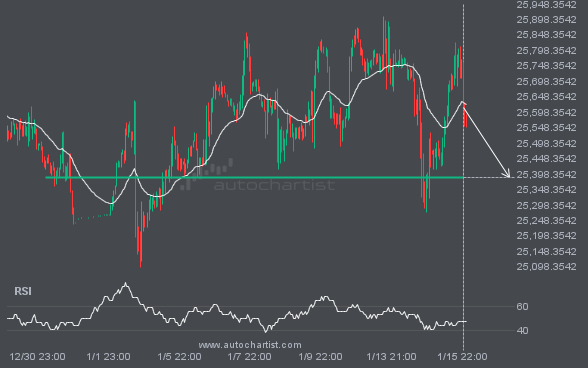
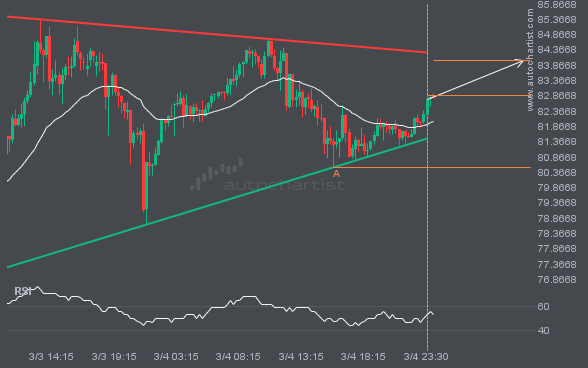
 NAS100 is heading toward 25386.9648 and could reach this level within the next 3 days. It has tested this level numerous times in the past, and this time could be no different, ending in a rebound rather than a breakout. If a breakout does not occur, we may see a retracement back to current levels.