Autochartist General
MARKET ANALYSIS

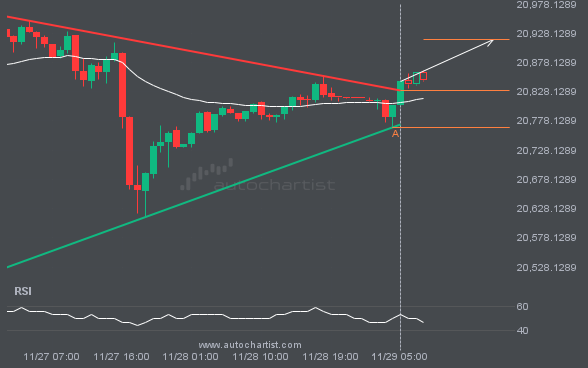
NAS100 has broken through a resistance line of a Triangle and suggests a possible movement to 20917.5509 within the next 12 hours. It has tested this line in the past, so one should probably wait for a confirmation of this breakout before taking action. If the breakout doesn’t confirm, we could see a retracement back to lines seen in the last 4 days.
S&P500 moved through the support line of a Rising Wedge at 6002.303124999999 on the 4 hour chart. This line has

You would be well advised to confirm the breakout that has just occurred – do you believe the move through

The movement of XAUUSD towards 2617.9399 price line is yet another test of the line it reached numerous times in

The movement of FTSE100 towards the support line of a Descending Triangle is yet another test of the line it

BTCUSD has broken through the resistance line of a Triangle technical chart pattern. Because we have seen it retrace from

NGC/USD has broken through a support line. It has touched this line numerous times in the last 6 days. This

An unexpected large move has occurred on USDJPY 1 hour chart beginning at 154.038 and ending at 151.829. Is this