MARKET ANALYSIS

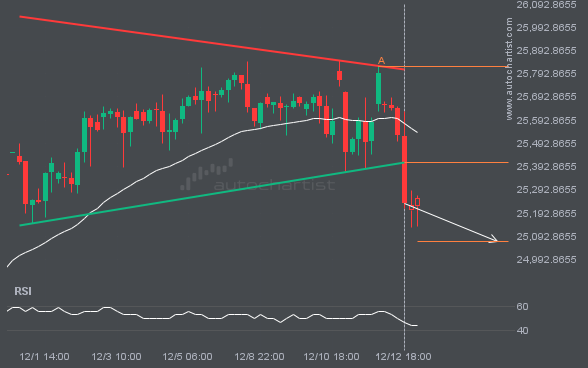
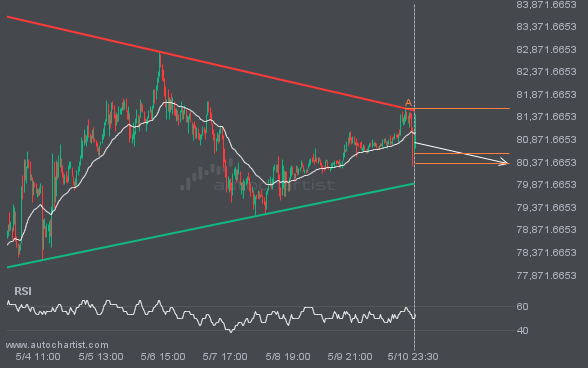
NAS100 has moved through the support line of a Triangle pattern at 25410.605817647058 on the 4 hour chart. This line has been tested multiple times in the past, and this breakout could signal an upcoming change in the current trend. Price may continue in the current direction toward 25071.0980.

A Rising Wedge pattern was identified for BRN/USD at 69.774, suggesting it may move toward the support line at 69.1426. It may break through that line and continue the bearish trend, or reverse from it.

A strong resistance level has been identified at 2016.8300 on the 15 Minutes ETHUSD chart. ETHUSD is likely to test this level soon.

This trade setup on XAGUSD formed after a period of consolidation, during which the price moved mostly sideways before choosing a longer-term direction. Following the bearish breakout through support, the price could move toward 77.5370.

A movement of 4.71% over 18 hours on BTCUSD does not go unnoticed. You may want to consider where it is heading next: a continuation of the current downward trend or a reversal of the prior trend.

NAS100 is heading toward 25052.8320 and could reach this level within the next 2 days. It has tested this level numerous times in the past, and this time could be no different, ending in a rebound rather than a breakout. If a breakout does not occur, we may see a retracement back to current levels.

USDJPY is heading toward the resistance line of a Channel Down pattern and could reach it within the next 17 hours. It has tested this line numerous times before, and this time may be no different, ending in a rebound instead of a breakout. If a breakout doesn’t occur, we could see a retracement back […]