Skip to content
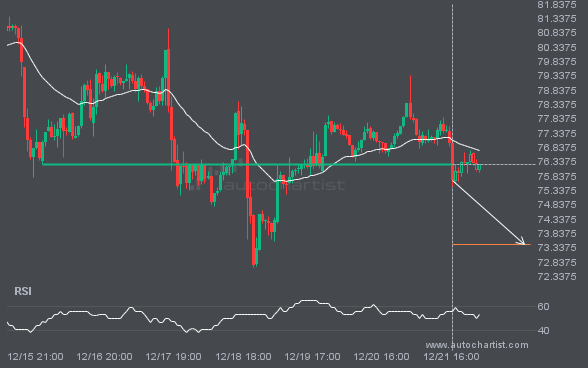
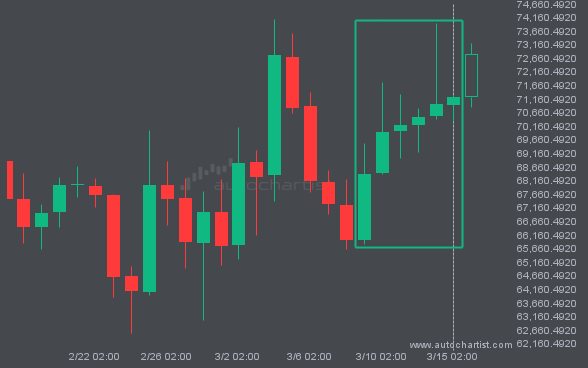
 LTCUSD has broken through a line at 76.2300. If this breakout holds, we could see the price of LTCUSD move toward 73.4370 within the next 2 days. However, don’t be too quick to trade. It has tested this line many times in the past, so confirm the breakout before placing any trades.