MARKET ANALYSIS

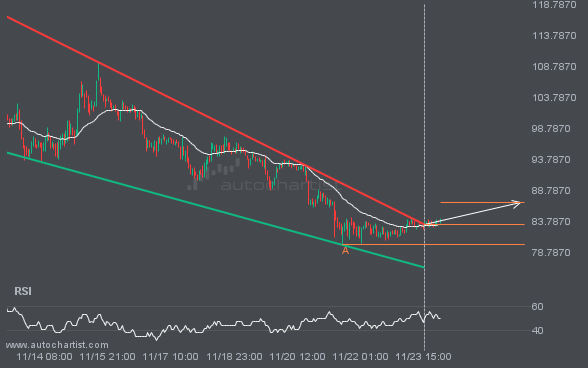
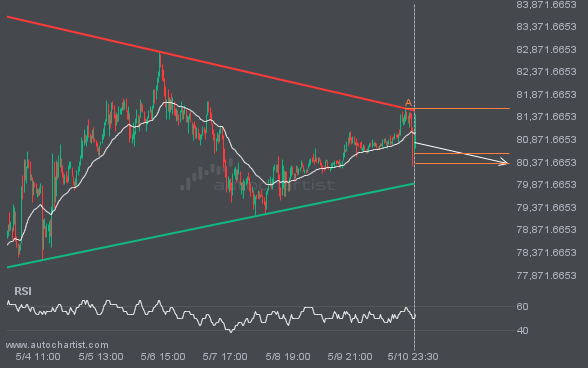
LTCUSD has broken through a resistance line of the Falling Wedge chart pattern. If this breakout holds, we may see the price of LTCUSD test 86.8634 within the next 3 days. But don’t rush to trade. It has tested this line before, so confirm the breakout before taking any action.

After posting 7 consecutive bullish candles over 9 days, consider where GBPJPY may be headed next: a continuation of the current upward trend or a reversal.

Triangle pattern identified on XAGUSD has broken through a support level, with price momentum continuing to move downward. This presents a solid trading opportunity, with the price expected to reach 48.2408 in the next 3.

LTCUSD is moving toward a resistance line it has tested many times. It has retraced from this line before, so it’s unclear whether it will break through or rebound again. If LTCUSD continues on its current trajectory, it could reach 90.9541 within the next 17 hours.

S&P500 just posted a 3.01% move over the past 6 hours—a move unlikely to go unnoticed by any trading style.

XAUUSD is approaching a support line at 3991.7000. If it hits the support line, it may break through this level to continue the bearish trend, or it may return to current levels.

ETHUSD is trapped in a Channel Down formation, implying that a breakout is imminent. This is a strong trade setup for both trend and swing traders. It is now approaching a support line that has been tested before. Divergence watchers may be optimistic about a potential breakout, which could mark the start of a new […]

EURUSD is moving toward a support line it has tested many times. It has retraced from this line before, so it’s unclear whether it will break through or rebound again. If EURUSD continues on its current trajectory, it could reach 1.1487 within the next 7 hours.