MARKET ANALYSIS

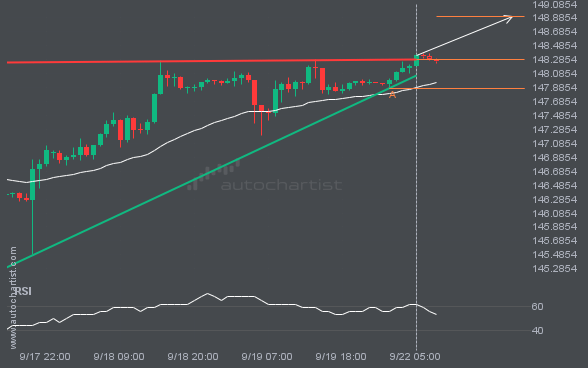
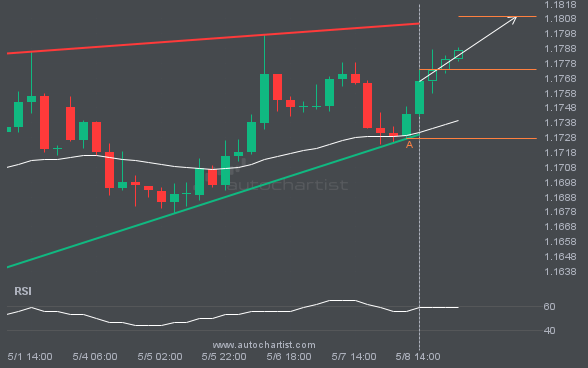
USDJPY moved through the resistance line of a Ascending Triangle at 148.29476086956518 on the 1 hour chart. This line has been tested a number of times in the past and this breakout could mean an upcoming change from the current trend. It may continue in its current direction toward 148.9053.

FTSE100 is moving towards a key support level at 9189.7500. This is a previously tested level for FTSE100. This could be a good trading opportunity, either at the spot price, or after breaching this level.

ETHUSD is heading towards the resistance line of a Triangle. If this movement continues, the price of ETHUSD could test 4522.5238 within the next 3 days. It has tested this line numerous times in the past, so this movement could be short-lived and end up rebounding just like it did in the past.

You would be well advised to confirm the breakout that has just occurred – do you believe the move through support to be significant? Do you have confirming indicators that the price momentum will continue? If so, look for a target of 198.9799 but consider reducing the size of your position as the price gets […]

FTSE100 recorded an exceptional 1.31% move over the last 5 days. Whether you follow trends or look for reversals, this move is hard to ignore.

ETHUSD is heading towards the support line of a Triangle. If this movement continues, the price of ETHUSD could test 4493.4050 within the next 3 days. It has tested this line numerous times in the past, so this movement could be short-lived and end up rebounding just like it did in the past.

XAUUSD is moving towards a resistance line. Because we have seen it retrace from this level in the past, we could see either a break through this line, or a rebound back to current levels. It has touched this line numerous times in the last 10 days and may test it again within the next […]