MARKET ANALYSIS

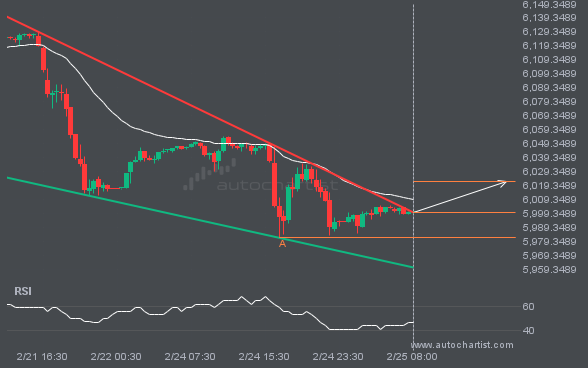
S&P500 has broken through the resistance line of a Falling Wedge technical chart pattern. Because we have seen it retrace from this line in the past, one should wait for confirmation of the breakout before taking any action. It has touched this line twice in the last 5 days and suggests a possible target level to be around 6022.1365 within the next 13 hours.
EURUSD is moving towards a key support level at 1.0447. This is a previously tested level for EURUSD. This could be a good trading opportunity, either at the spot price, or after breaching this level.

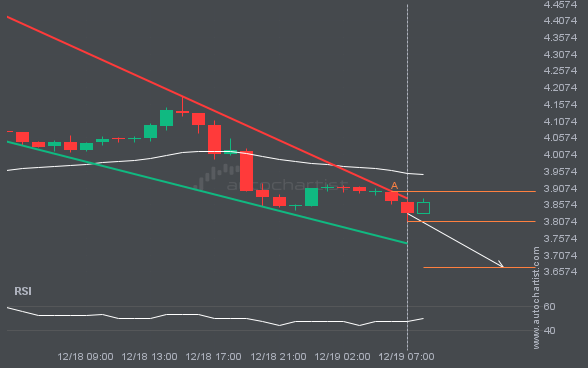
Those of you that are trend followers are probably eagerly watching BRN/USD to see if its latest 3.4% move continues. If not, the mean-reversion people out there will be delighted with this exceptionally large 2 days move.

GBPJPY is heading towards the support line of a Channel Down and could reach this point within the next 2 days. It has tested this line numerous times in the past, and this time could be no different from the past, ending in a rebound instead of a breakout. If the breakout doesn’t happen, we […]

The last 17 4 hour candles on LTCUSD formed a Rising Wedge pattern and broken out through the pattern lines, indicating a possible bearish movement towards the price level of 113.4731.

FTSE100 has broken through a support line. It has touched this line numerous times in the last 23 days. This breakout shows a potential move to 8522.5400 within the next 2 days. Because we have seen it retrace from this level in the past, one should wait for confirmation of the breakout.

NGC/USD is trapped in a Rising Wedge formation, implying that a breakout is Imminent. This is a great trade-setup for both trend and swing traders. It is now approaching a support line that has been tested in the past. Divergence opportunists may be very optimistic about a possible breakout and this may be the start […]

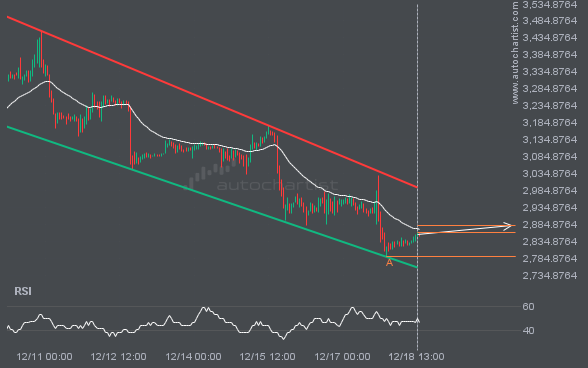
A strong resistance level has been identified at 2778.1201 on the 30 Minutes ETHUSD chart. ETHUSD is likely to test it soon.