Autochartist General
MARKET ANALYSIS

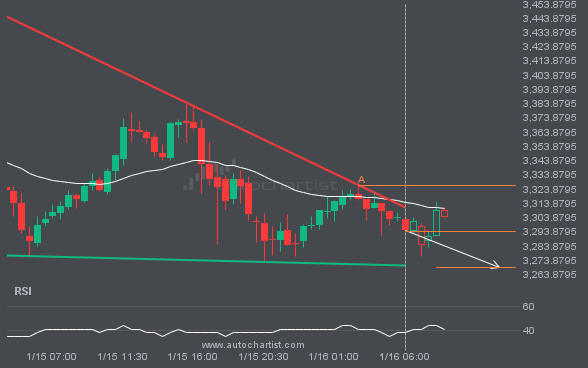
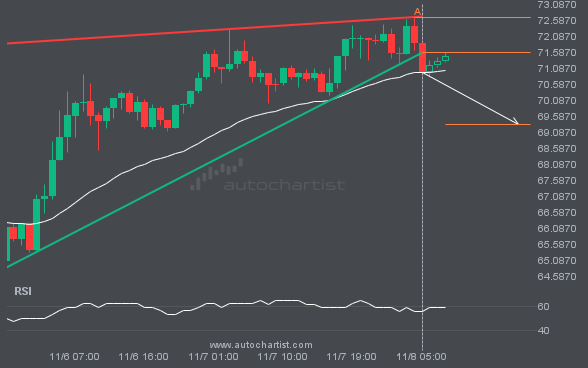
LTCUSD has broken through a support line. It has touched this line at least twice in the last 3 days. This breakout may indicate a potential move to 69.3164 within the next 12 hours. Because we have seen it retrace from this position in the past, one should wait for confirmation of the breakout before trading.
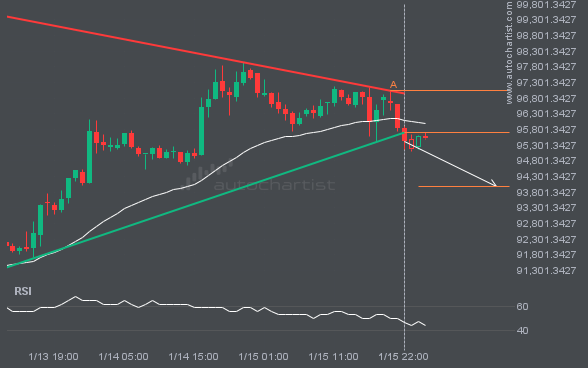
Emerging Rising Wedge pattern in its final wave was identified on the ETHUSD 30 Minutes chart. After a strong bullish

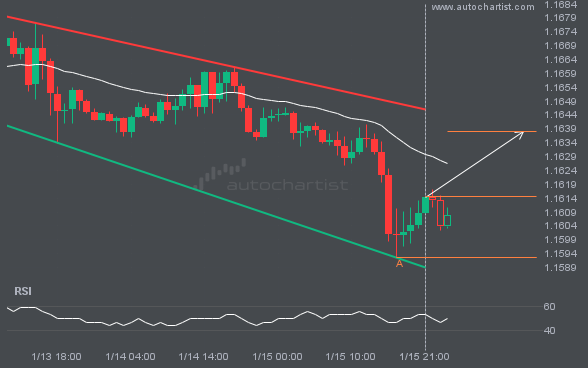
Emerging Channel Down pattern in its final wave was identified on the EURUSD 4 hour chart. After a strong bearish

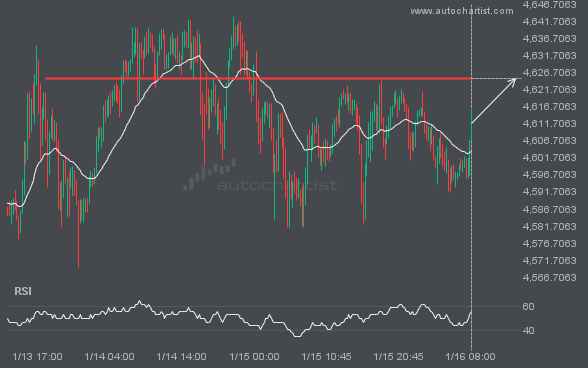
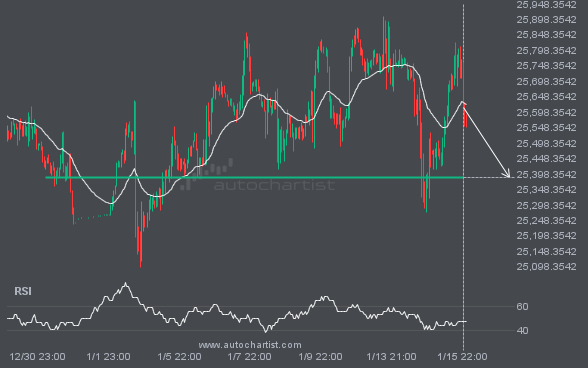
NAS100 is en route to a very important line that will be a definite deciding factor of what is to

A movement of 7.74% over 16 hours on BTCUSD doesn’t go unnoticed. You may start considering where it’s heading next,

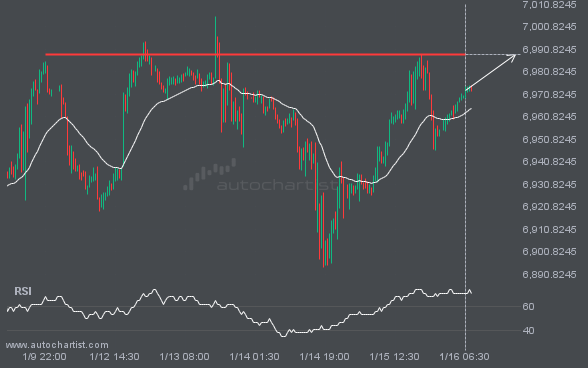
FTSE100 is moving towards a resistance line. Because we have seen it retrace from this level in the past, we

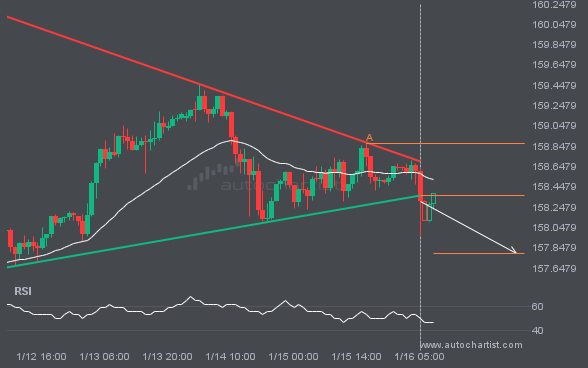
Emerging Rising Wedge pattern in its final wave was identified on the USDJPY 4 hour chart. After a strong bullish