MARKET ANALYSIS

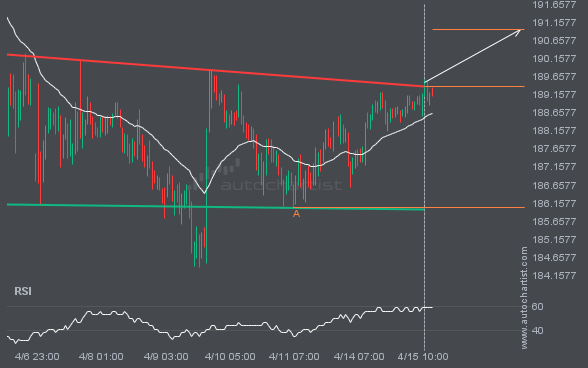
Inverse Head and Shoulders pattern identified on GBPJPY has broken through a resistance level with the price momentum continuing to move in an upward direction. A solid trading opportunity continues with the price expected to reach 190.9501 in the next 2.

LTCUSD is moving toward a resistance line. Because it has retraced from this level in the past, we may see either a breakout through this line or a rebound to current levels. It has touched this line multiple times over the last 8 days and may test it again within the next 2 days.

XAUUSD is moving toward a support line. Since it has retraced from this line before, we may see either a breakout through it or a rebound to current levels. It has touched this line multiple times in the past 18 days and may test it again within the next 3 days.

A rare candlestick sequence was recorded on the ETHUSD Daily chart, ending at 2346.6900.

S&P500 has broken through a line at 7214.6802. If this breakout holds, we could see the price of S&P500 move toward 7178.7388 within the next 7 hours. However, don’t be too quick to trade. It has tested this line many times in the past, so confirm the breakout before placing any trades.

NGC/USD has broken through a line at 2.7365. If this breakout holds, we could see the price of NGC/USD move toward 2.7796 within the next 3 days. However, don’t be too quick to trade. It has tested this line many times in the past, so confirm the breakout before placing any trades.

Triangle pattern identified on GBPJPY has broken through a support level, with price momentum continuing to move downward. This presents a solid trading opportunity, with the price expected to reach 211.4635 in the next 11.

This trade setup on NAS100 formed after a period of consolidation, during which the price moved mostly sideways before choosing a longer-term direction. Following the bearish breakout through support, the price could move toward 27703.0311.