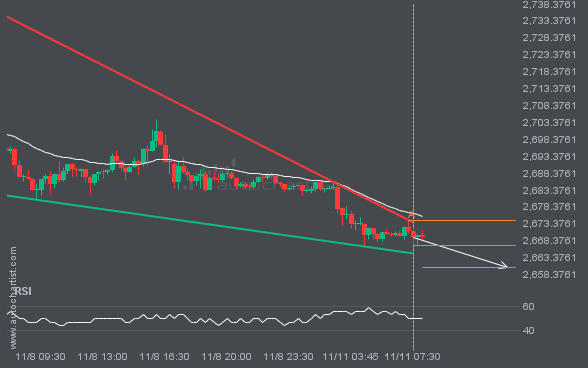
XAUUSD is approaching the support line of a Falling Wedge. It has touched this line numerous times in the last 4 days. If it tests this line again, it should do so in the next 6 hours.
 Skip to content
 XAUUSD is approaching the support line of a Falling Wedge. It has touched this line numerous times in the last 4 days. If it tests this line again, it should do so in the next 6 hours.
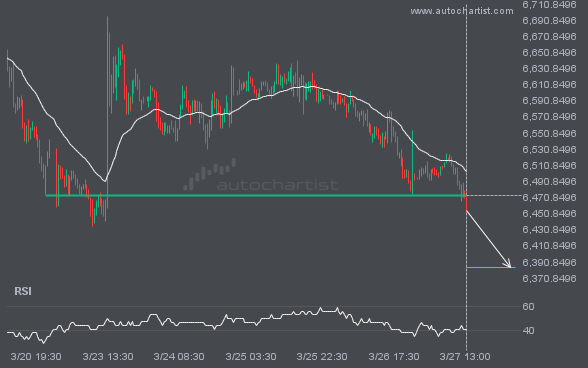
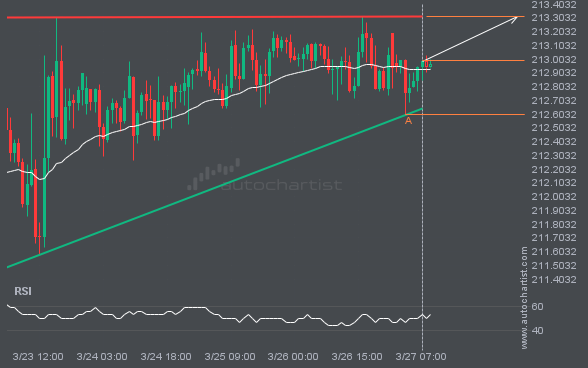
S&P500 is once again retesting a key horizontal support level at 6473.7402. This level has been tested 3 times recently and could see another bounce, as it did last time. However, after so many attempts, it may be ready to start a new trend.
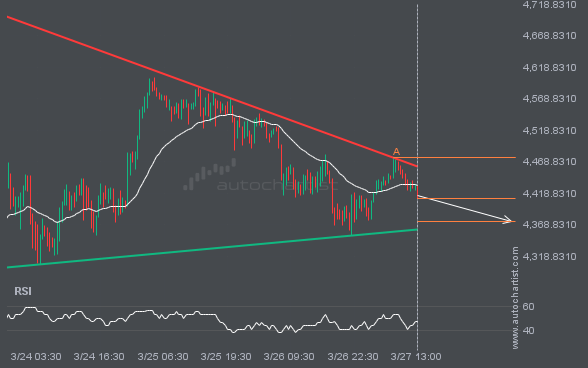
An emerging Triangle pattern has been detected for XAUUSD on the 30 Minutes chart. There may be a move toward 4374.3709 in the next few candles. Once it reaches the support, it may continue its bearish run or revert to current price levels.
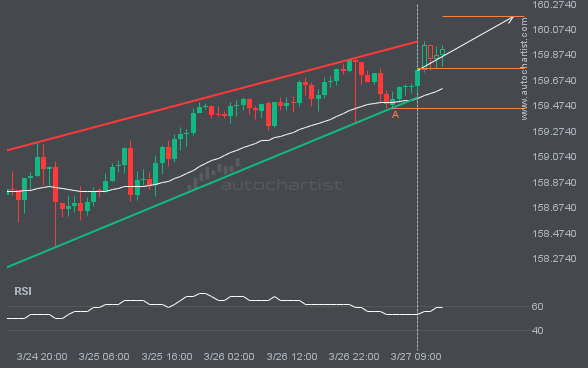
An emerging Rising Wedge has been detected on USDJPY. The pattern has not yet broken through support, but the price is expected to move up over the next few hours. At the time the pattern was found, the price was 159.7705, and it is expected to move to 160.1755.
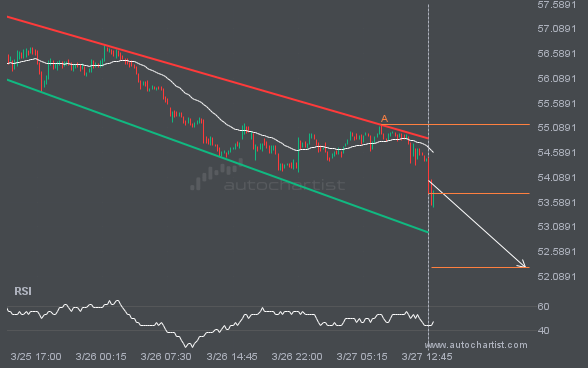
LTCUSD was identified around 53.77 after recently rebounding off the resistance on the 15 Minutes interval. Ultimately, the stock’s price action has formed a Channel Down pattern. This squeeze may increase the chances of a strong breakout. The projected move could take the price to around 52.2720.
GBPJPY is moving toward a resistance line. Since it has retraced from this line before, we may see either a breakout through it or a rebound to current levels. It has touched this line multiple times in the past 5 days and may test it again within the next 2 days.
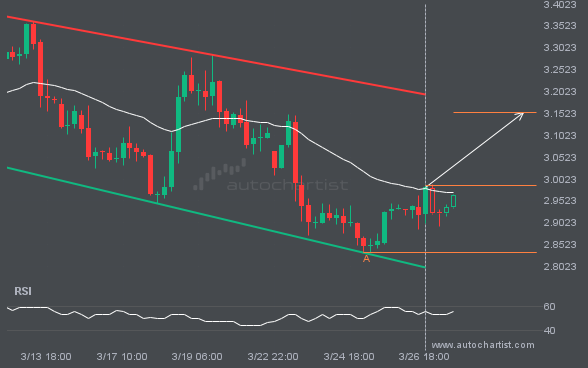
NGC/USD is heading toward the resistance line of a Channel Down pattern and could reach it within the next 3 days. It has tested this line numerous times before, and this time may be no different, ending in a rebound instead of a breakout. If a breakout doesn’t occur, we could see a retracement back […]
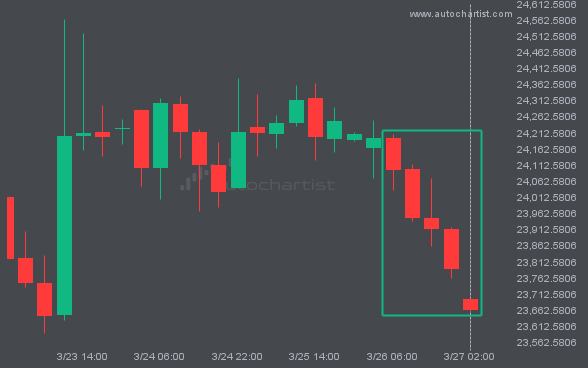
NAS100 posted 5 consecutive candles over the last 20 hours — an unusually large movement.