MARKET ANALYSIS

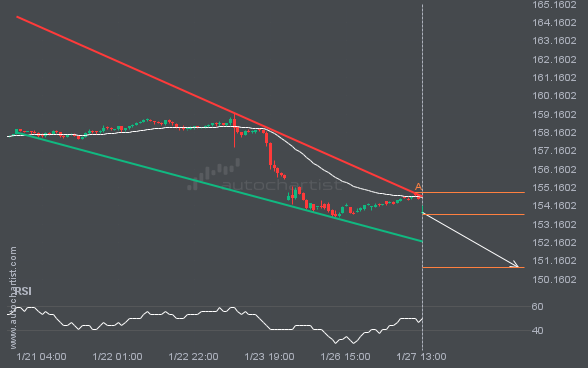
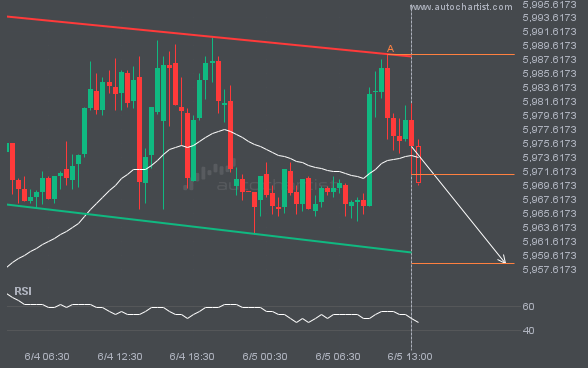
S&P500 is trapped in a Channel Down formation, implying that a breakout is Imminent. This is a great trade-setup for both trend and swing traders. It is now approaching a resistance line that has been tested in the past. Divergence opportunists may be very optimistic about a possible breakout and this may be the start of a new trend. It may also be that this convergence factor may result in the ideal setup for swing traders that are on the lookout for a possible bounce-back. Whatever happens, an initial move towards 5958.4263 is expected in the short term.
GBPJPY is heading towards the support line of a Triangle and could reach this point within the next 3 days. It has tested this line numerous times in the past, and this time could be no different from the past, ending in a rebound instead of a breakout. If the breakout doesn’t happen, we could […]

LTCUSD has broken through 88.8100 which it has tested numerous times in the past. We have seen it retrace from this price in the past. If this new trend persists, LTCUSD may be heading towards 86.2090 within the next 2 days.

USDJPY is moving towards a key resistance level at 144.5425. USDJPY has previously tested this level 6 times and on each occasion it has bounced back off this level. Is this finally the time it will break through?

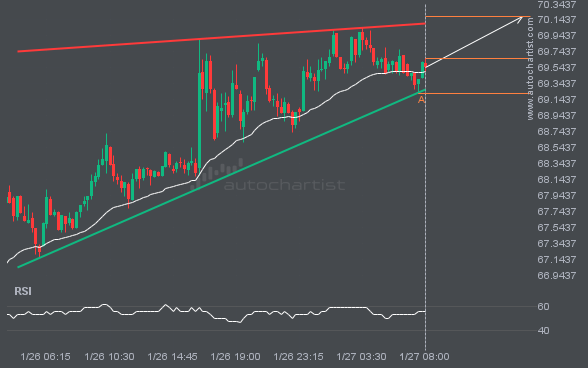
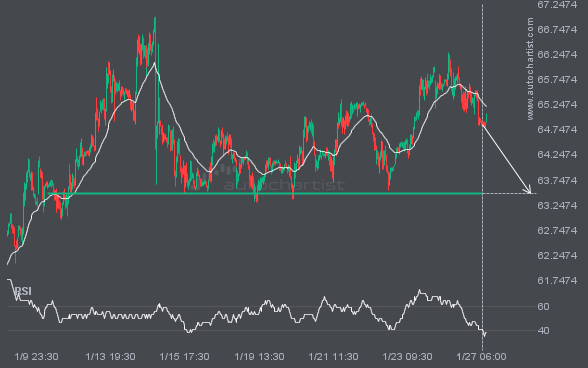
Emerging Rising Wedge pattern in its final wave was identified on the BRN/USD 30 Minutes chart. After a strong bullish run, we find BRN/USD heading towards the upper triangle line with a possible resistance at 66.6281. If the resistance shows to hold, the Rising Wedge pattern suggests a rebound back towards current levels.

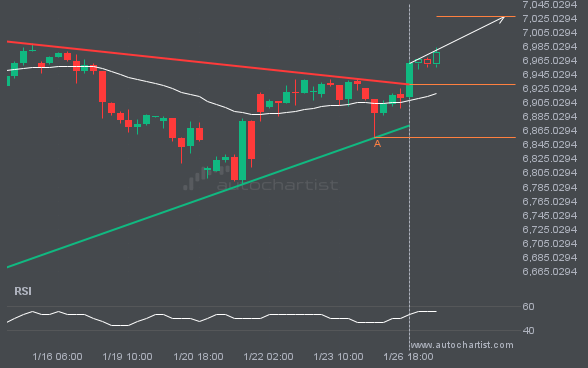
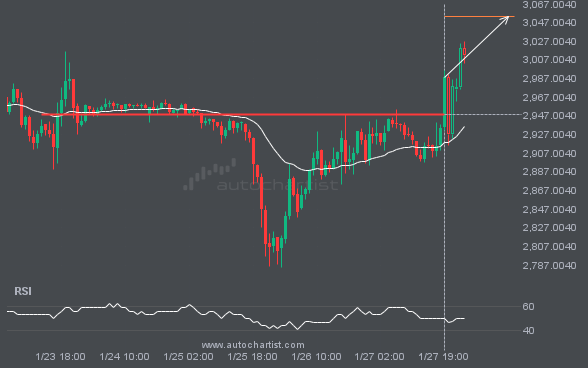
FTSE100 has broken through a line of 8798.8496. If this breakout holds true, we could see the price of FTSE100 heading towards 8867.8564 within the next 20 hours. But don’t be so quick to trade, it has tested this line numerous times in the past, so you should probably confirm the breakout before placing any […]

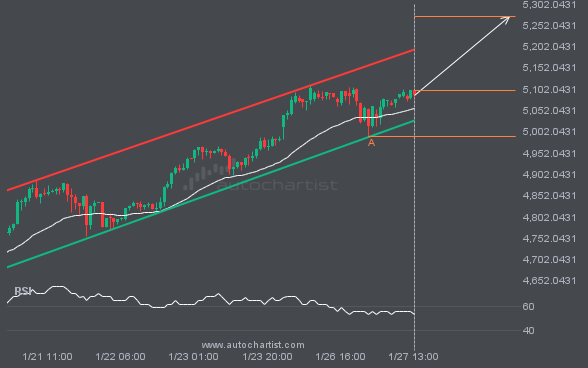
Emerging Channel Up pattern in its final wave was identified on the BTCUSD 15 Minutes chart. After a strong bullish run, we find BTCUSD heading towards the upper triangle line with a possible resistance at 107524.2451. If the resistance shows to hold, the Channel Up pattern suggests a rebound back towards current levels.

The last 5 1 hour candles on XAGUSD formed a Triangle pattern and broken out through the pattern lines, indicating a possible bearish movement towards the price level of 34.1677.