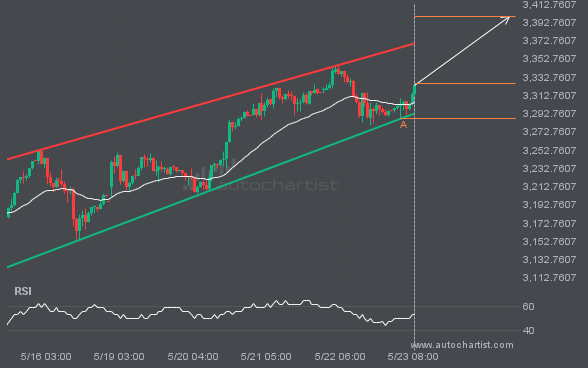
A Channel Up pattern was identified on XAUUSD at 3325.76, creating an expectation that it may move to the resistance line at 3399.0149. It may break through that line and continue the bullish trend or it may reverse from that line.
 Skip to content
 A Channel Up pattern was identified on XAUUSD at 3325.76, creating an expectation that it may move to the resistance line at 3399.0149. It may break through that line and continue the bullish trend or it may reverse from that line.
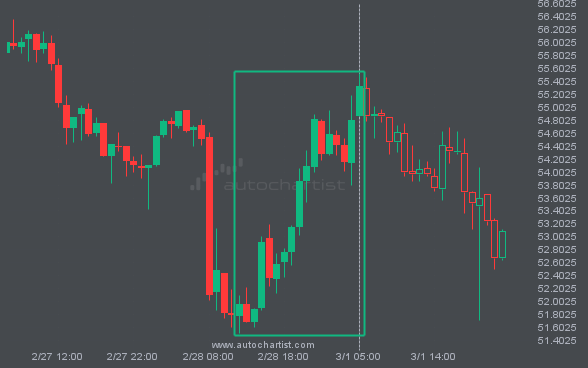
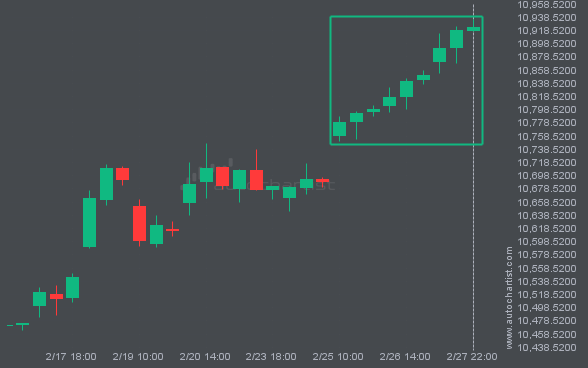
LTCUSD has moved higher by 6.47% from 51.96 to 55.32 in the last 17 hours.
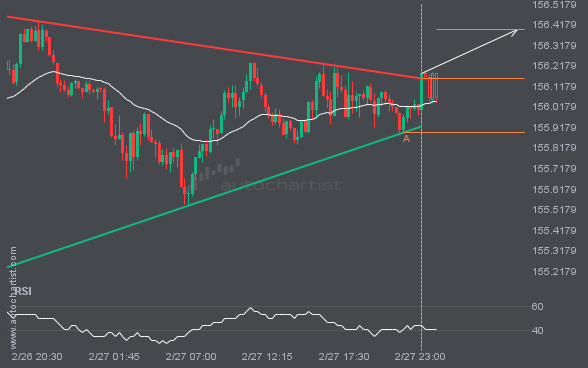
USDJPY has broken through a resistance line of the Triangle chart pattern. If this breakout holds, we may see the price of USDJPY test 156.3917 within the next 7 hours. But don’t rush to trade. It has tested this line before, so confirm the breakout before taking any action.
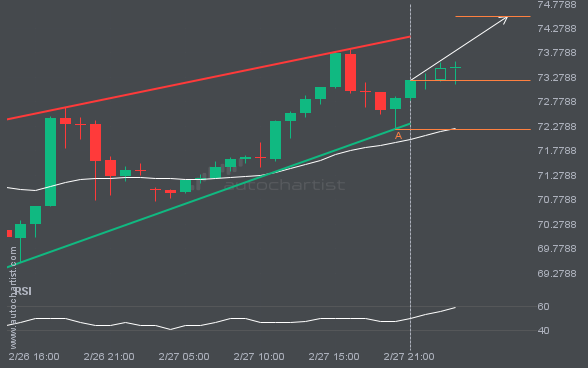
BRN/USD is moving toward a resistance line. Since it has retraced from this line before, we may see either a breakout through it or a rebound to current levels. It has touched this line multiple times in the past 2 days and may test it again within the next 5 hours.
After posting 9 consecutive bullish candles over 3 days, consider where FTSE100 may be headed next: a continuation of the current upward trend or a reversal.
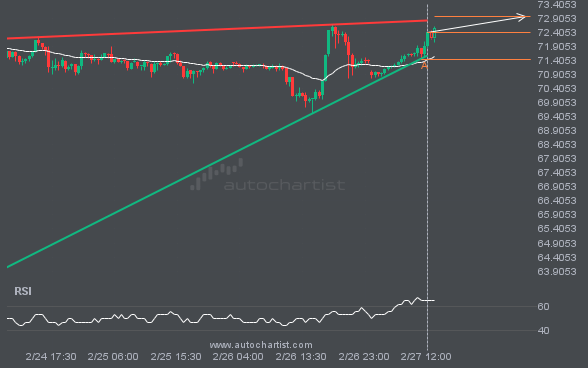
BRN/USD is trapped in a Rising Wedge formation, implying that a breakout is imminent. This is a strong trade setup for both trend and swing traders. It is now approaching a support line that has been tested before. Divergence watchers may be optimistic about a potential breakout, which could mark the start of a new […]
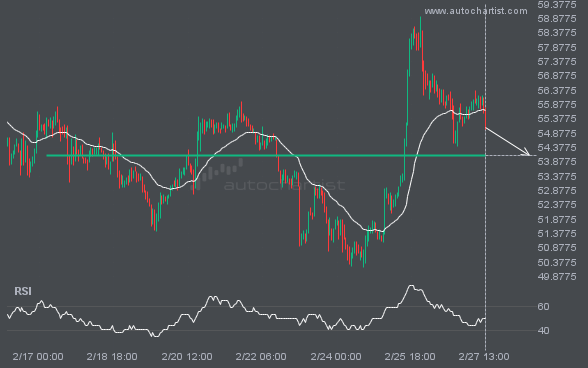
LTCUSD is about to retest a key horizontal support level near 54.0800. It has tested this level 6 times recently and may simply bounce off it, as it did last time. However, after so many attempts, it may be ready to start a new trend.
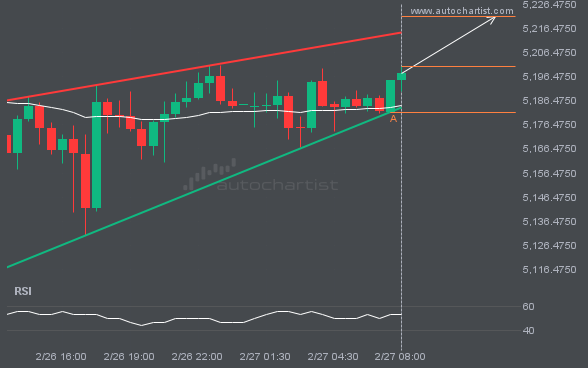
XAUUSD is heading toward the resistance line in a Rising Wedge pattern. If this move continues, the price of XAUUSD could test 5221.2819 within the next 5 hours. It has tested this line many times before, so the move could be short-lived and may rebound as it has before.