Autochartist General
MARKET ANALYSIS

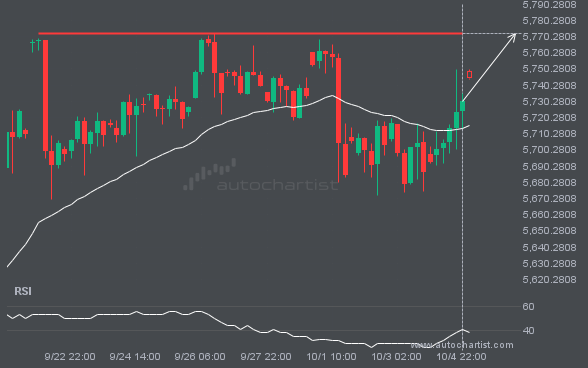
The price of S&P500 in heading back to the resistance area. It is possible that it will struggle to break through it and move back in the other direction. The price may eventually break through, but typically the price retreats from the level a number of times before doing so.
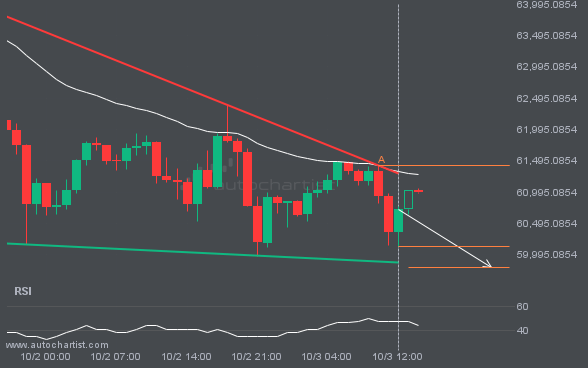
An emerging Falling Wedge has been detected on BTCUSD on the 1 hour chart. There is a possible move towards

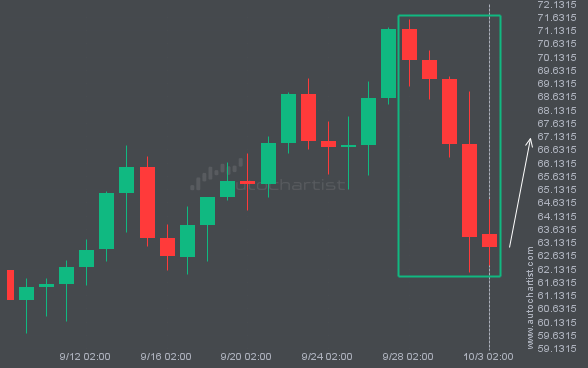
LTCUSD has experienced an exceptionally large amount of consecutive bearish candles to reach a price of 62.9600 in the last

NGC/USD is approaching the resistance line of a Rising Wedge. It has touched this line numerous times in the last

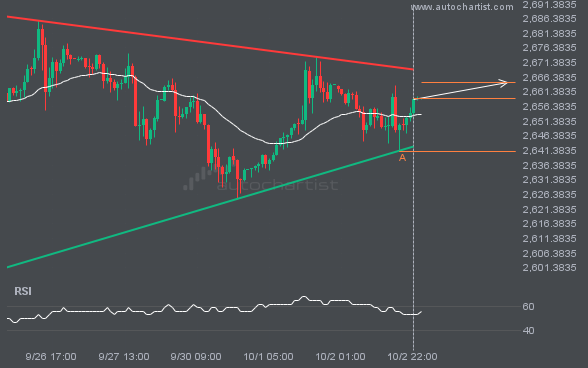
Emerging Triangle pattern in its final wave was identified on the XAUUSD 1 hour chart. After a strong bullish run,

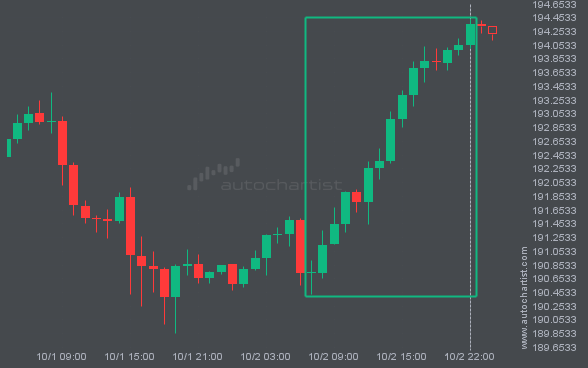
Those of you that are trend followers are probably eagerly watching GBPJPY to see if its latest 1.89% move continues.

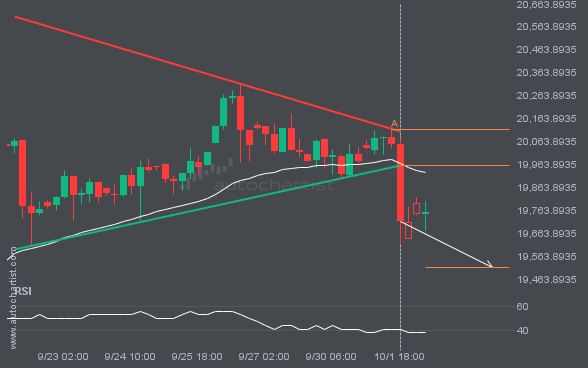
The last 12 4 hour candles on NAS100 formed a Triangle pattern and broken out through the pattern lines, indicating

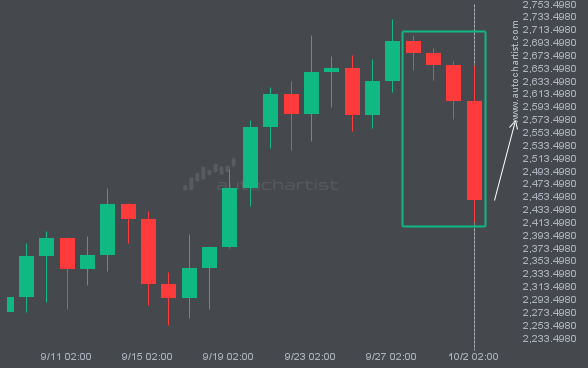
Due to the rate of consecutive bearish candles on ETHUSD Daily chart we could be in for a price correction.