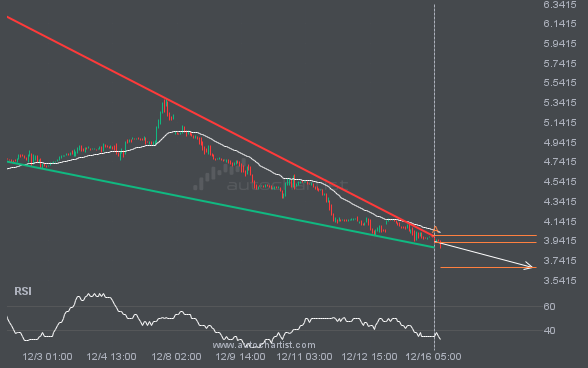
XAGUSD is trapped in a Triangle formation, implying that a breakout is imminent. This is a strong trade setup for both trend and swing traders. It is now approaching a support line that has been tested before. Divergence watchers may be optimistic about a potential breakout, which could mark the start of a new trend. […]
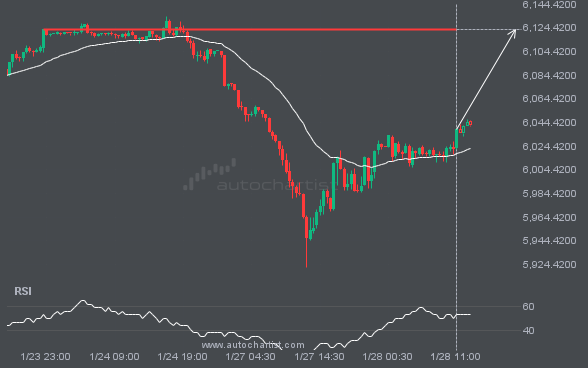
An emerging Channel Down has been detected on NAS100. The pattern has not yet broken through support, but the price is expected to move up over the next few hours. At the time the pattern was found, the price was 25075.4569, and it is expected to move to 25149.5324.
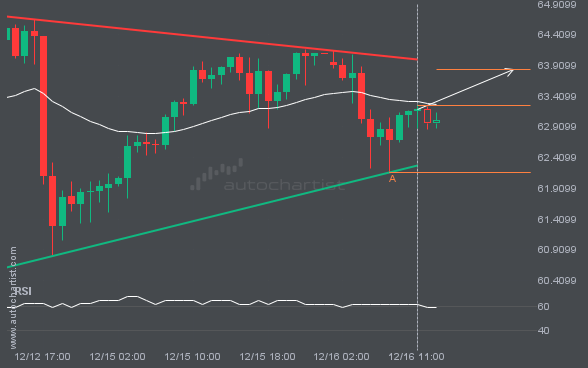
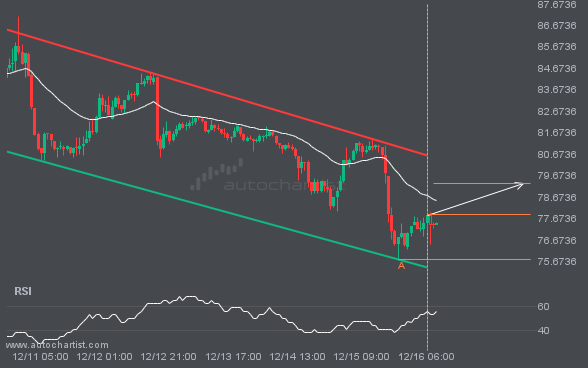
GBPJPY is moving toward a resistance line. Because it has retraced from this level in the past, we may see either a breakout through this line or a rebound to current levels. It has touched this line multiple times over the last 7 days and may test it again within the next 2 days.
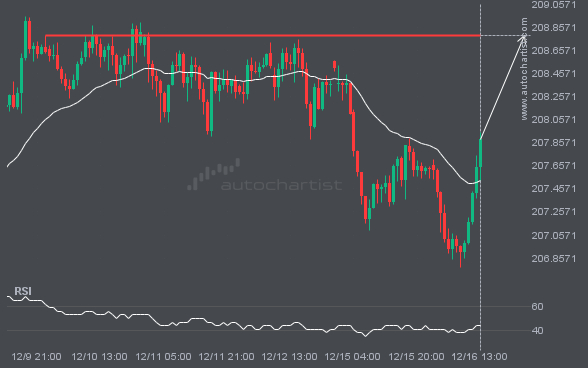
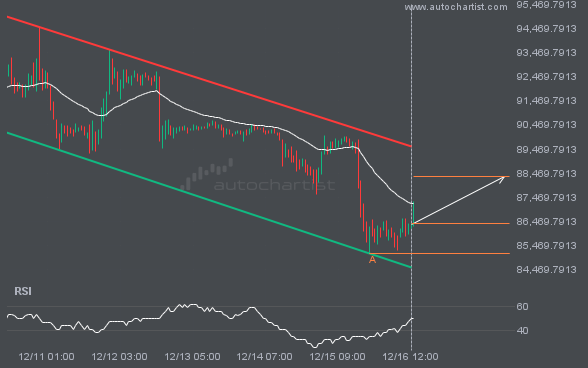
BTCUSD is moving toward a resistance line. Since it has retraced from this line before, we may see either a breakout through it or a rebound to current levels. It has touched this line multiple times in the past 8 days and may test it again within the next 2 days.
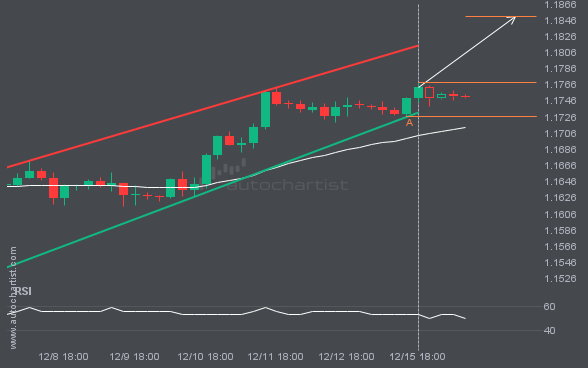
EURUSD is moving toward a resistance line it has tested many times. It has retraced from this line before, so it’s unclear whether it will break through or rebound again. If EURUSD continues on its current trajectory, it could reach 1.1850 within the next 2 days.
An emerging Channel Down pattern in its final wave has been identified on the LTCUSD 1 hour chart. After a strong bullish run, LTCUSD is heading toward the upper triangle trendline, with possible resistance at 79.3020. If the resistance holds, the Channel Down pattern suggests a rebound toward current levels.
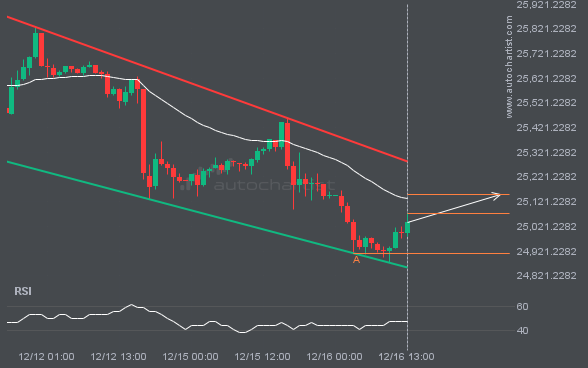
NGC/USD is moving toward a support line. Since it has retraced from this line before, we may see either a breakout through this line or a rebound to current levels. It has touched this line numerous times in the last 20 days and may test it again within the next 3 days.