Autochartist General
MARKET ANALYSIS

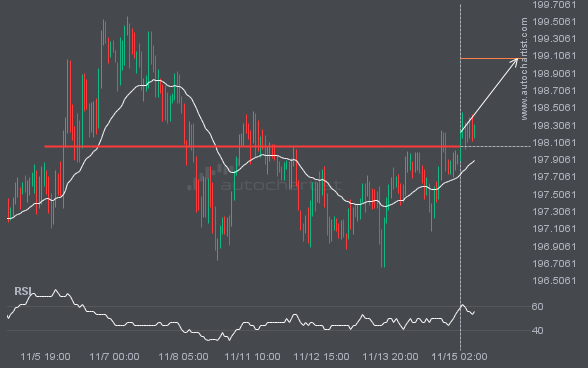
GBPJPY is once again retesting a key horizontal resistance level at 198.0620. It has tested this level 3 times in the recent past and could simply bounce off like it did last time. However, after this many tries, maybe it’s ready to start a new trend.
Emerging Falling Wedge pattern in its final wave was identified on the S&P500 15 Minutes chart. After a strong bearish

A Falling Wedge pattern was identified on XAGUSD at 30.199, creating an expectation that it may move to the support

GBPJPY is moving towards a resistance line. Because we have seen it retrace from this line before, we could see

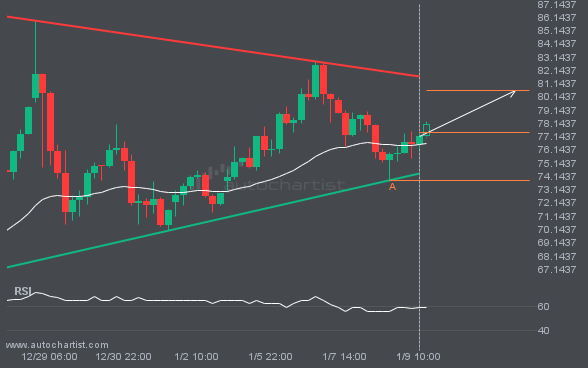
An emerging Rising Wedge has been detected on NGC/USD on the 15 Minutes chart. There is a possible move towards

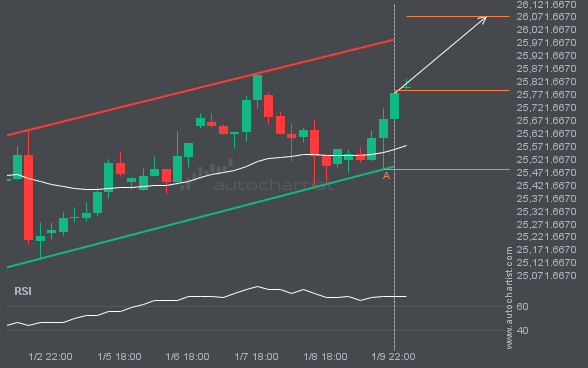
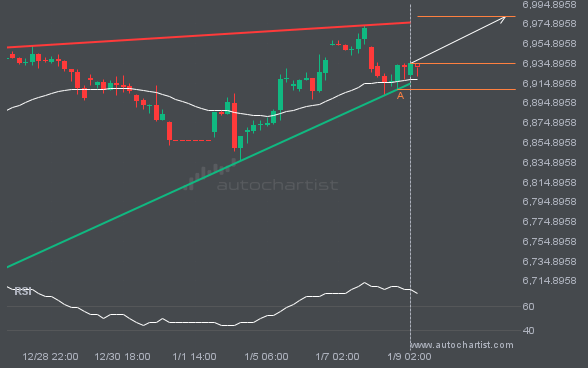
Emerging Rising Wedge pattern in its final wave was identified on the ETHUSD 30 Minutes chart. After a strong bullish

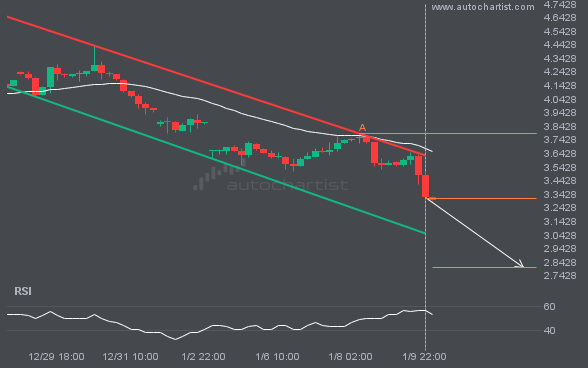
Emerging Channel Down pattern in its final wave was identified on the EURUSD 4 hour chart. After a strong bearish

NAS100 is en route to a very important line that will be a definite deciding factor of what is to