MARKET ANALYSIS

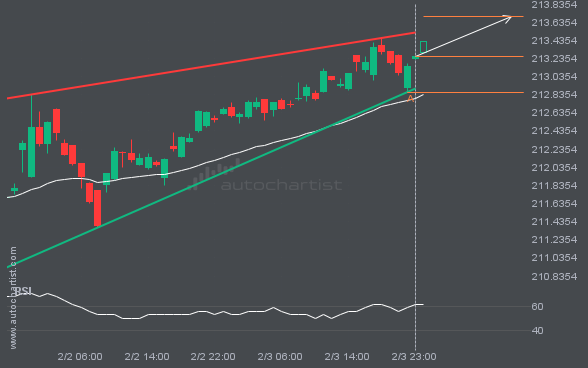
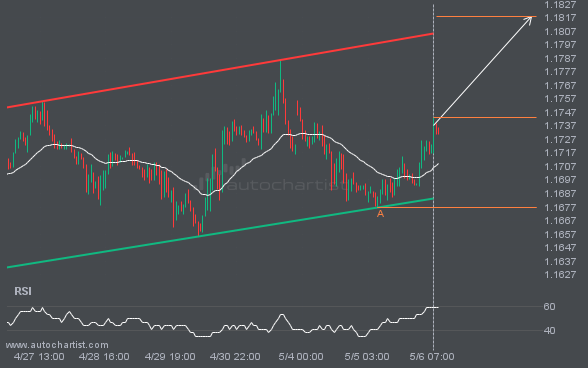
GBPJPY is heading toward the resistance line in a Rising Wedge pattern. If this move continues, the price of GBPJPY could test 213.6970 within the next 13 hours. It has tested this line many times before, so the move could be short-lived and may rebound as it has before.

XAUUSD is approaching a support line at 4747.6250. If it hits the support line, it may break through this level to continue the bearish trend, or it may return to current levels.

GBPJPY is moving toward a resistance line. Since it has retraced from this line before, we may see either a breakout through it or a rebound to current levels. It has touched this line multiple times in the past 13 days and may test it again within the next 3 days.

FTSE100 has broken through a support line. Because it has previously retraced from this price, you should wait for confirmation of the breakout before trading. It has touched this line multiple times over the past 6 days, which suggests a possible target around 10557.9355 within the next 5 hours.

LTCUSD has broken through a resistance line. Because it has previously retraced from this price, you should wait for confirmation of the breakout before trading. It has touched this line multiple times over the past 8 days, which suggests a possible target around 56.4360 within the next 2 days.

USDJPY is moving toward a key resistance level at 159.3210. This level has been tested before for USDJPY. This may present a good trading opportunity either at the spot price or after a breakout through this level.

The last 5 30 Minutes candles on NAS100 have formed a Triangle pattern and broken out through the pattern lines, indicating a possible bearish movement toward the price level at 25512.7749.

BTCUSD is moving toward a support line. Since it has retraced from this line before, we may see either a breakout through it or a rebound to current levels. It has touched this line multiple times in the past 12 days and may test it again within the next 3 days.