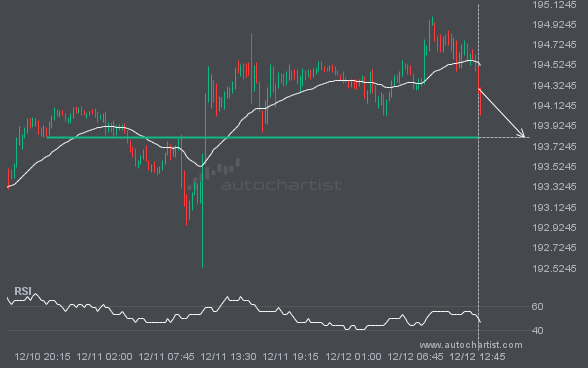
GBPJPY is moving towards a key support level at 193.8120. This is a previously tested level for GBPJPY. This could be a good trading opportunity, either at the spot price, or after breaching this level.
 Skip to content
 GBPJPY is moving towards a key support level at 193.8120. This is a previously tested level for GBPJPY. This could be a good trading opportunity, either at the spot price, or after breaching this level.

LTCUSD has breached the resistance line at 105.2400. It may continue the bullish trend towards 109.2020, or, it may prove to be yet another test of this level.

A strong resistance level has been breached at 31.9950 on the 1 hour XAGUSD chart. Technical Analysis theory forecasts a movement to 32.4764 in the next 22 hours.
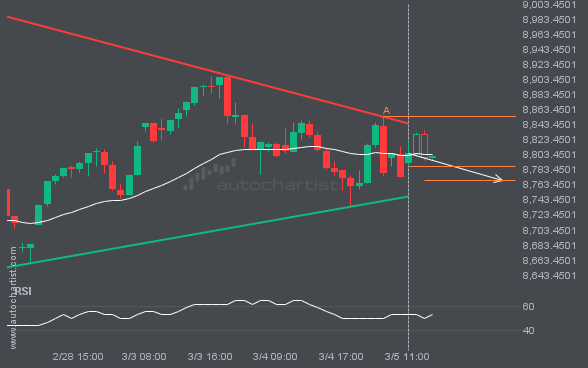
FTSE100 was identified at around 8787.69 having recently rebounded of the resistance on the 1 hour data interval. Ultimately, the price action of the stock has formed a Triangle pattern. This squeeze may increases the chances of a strong breakout. The projected movement will potentially take the price to around the 8769.6346 level.
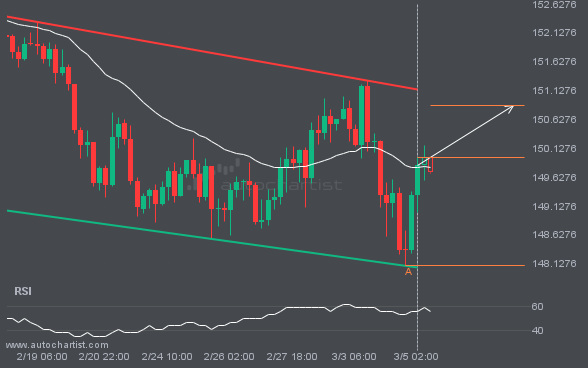
USDJPY is heading towards the resistance line of a Channel Down and could reach this point within the next 3 days. It has tested this line numerous times in the past, and this time could be no different from the past, ending in a rebound instead of a breakout. If the breakout doesn’t happen, we […]
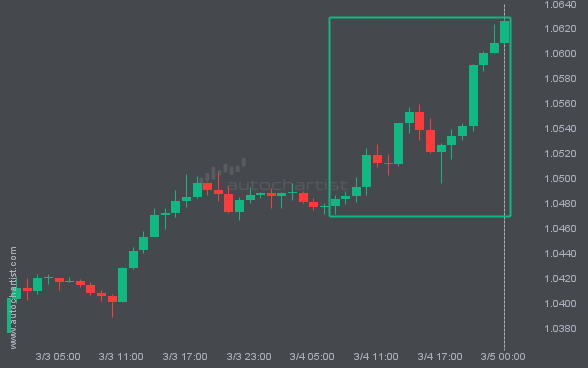
EURUSD hits 1.06262 after a 1.36% move spanning 17 hours.
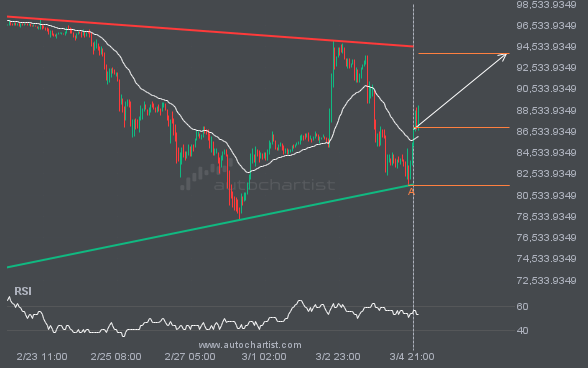
BTCUSD is heading towards the resistance line of a Triangle. If this movement continues, the price of BTCUSD could test 93912.1225 within the next 3 days. It has tested this line numerous times in the past, so this movement could be short-lived and end up rebounding just like it did in the past.

XAUUSD is moving towards a resistance line which it has tested numerous times in the past. We have seen it retrace from this line before, so at this stage it isn’t clear whether it will breach this line or rebound as it did before. If XAUUSD continues in its current trajectory, we could see it […]