GBPJPY: Significant movement recorded.
 Skip to content
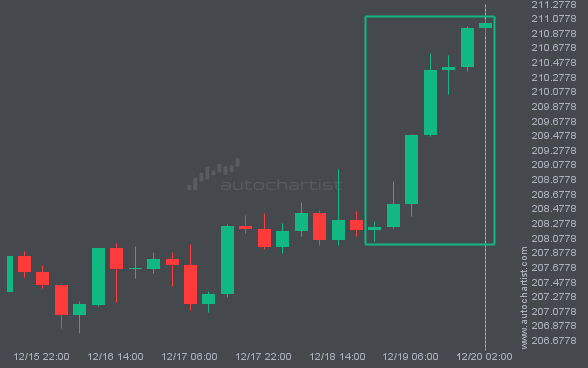
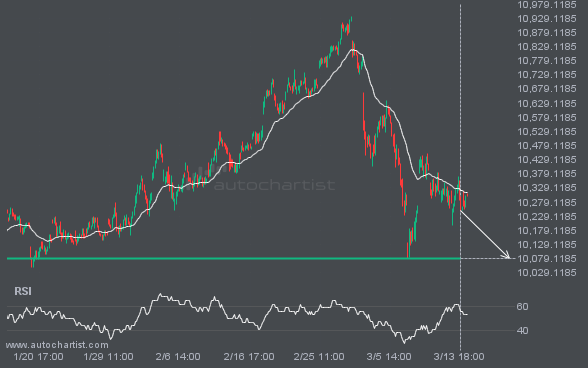
A strong support level has been identified at 10077.9502 on the 1 hour FTSE100 chart. FTSE100 is likely to test this level soon.
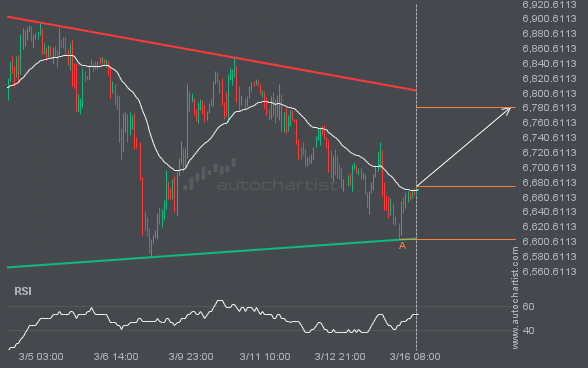
An emerging Triangle pattern in its final wave has been identified on the S&P500 1 hour chart. After a strong bullish run, S&P500 is heading toward the upper triangle trendline, with possible resistance at 6780.8449. If the resistance holds, the Triangle pattern suggests a rebound toward current levels.
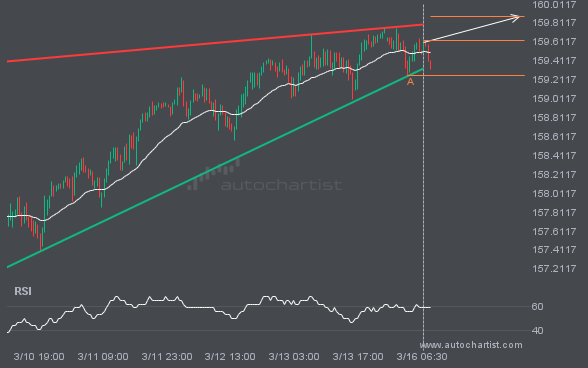
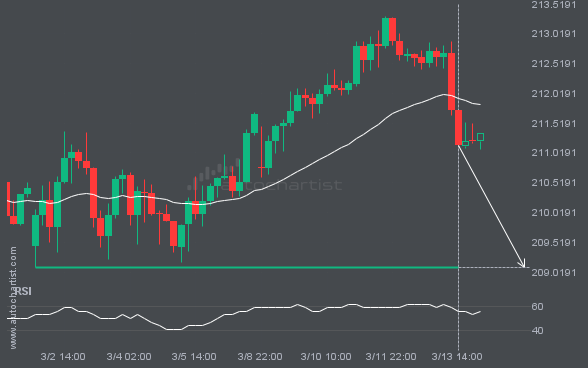
USDJPY is trapped in a Rising Wedge formation, implying that a breakout is imminent. This is a strong trade setup for both trend and swing traders. It is now approaching a support line that has been tested before. Divergence watchers may be optimistic about a potential breakout, which could mark the start of a new […]
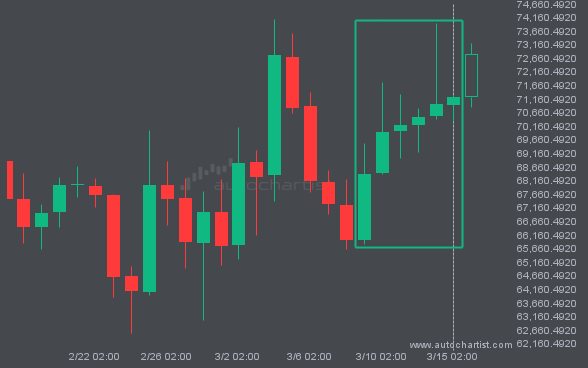
BTCUSD saw a large number of bullish candles that reached 71214.9900 over 7 days.
The price of GBPJPY is heading back toward the support area. It may struggle to break through and could reverse direction. The price may eventually break through, but it typically retreats from the level several times before doing so.
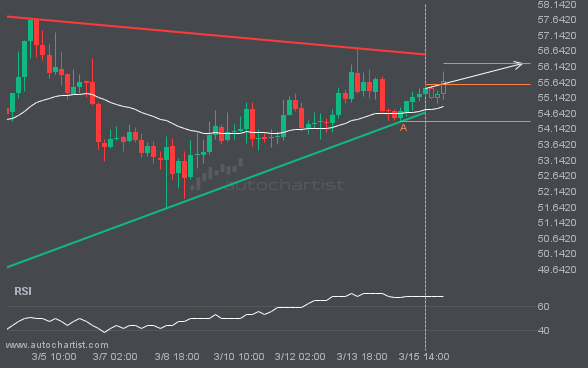
A Triangle pattern was identified for LTCUSD at 55.57, suggesting it may move toward the resistance line at 56.2264. It may break through that line and continue the bullish trend, or reverse from it.
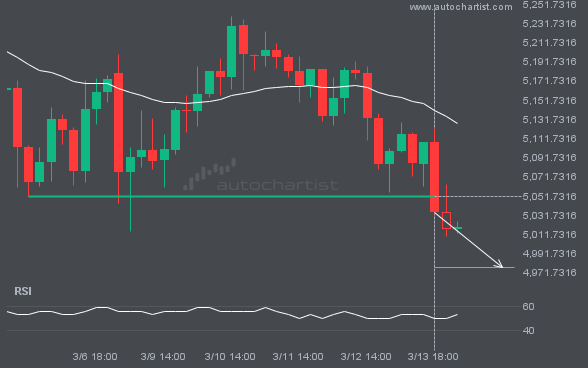
XAUUSD has broken through a support line. Because it has previously retraced from this price, you should wait for confirmation of the breakout before trading. It has touched this line multiple times over the past 9 days, which suggests a possible target around 4977.4375 within the next 2 days.