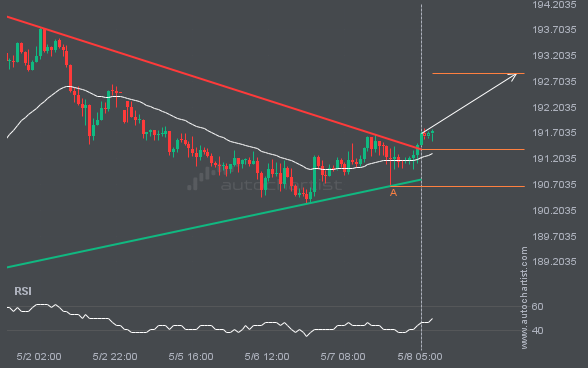
GBPJPY moved through the resistance line of a Triangle at 191.3827272727273 on the 1 hour chart. This line has been tested a number of times in the past and this breakout could mean an upcoming change from the current trend. It may continue in its current direction toward 192.8505.