MARKET ANALYSIS

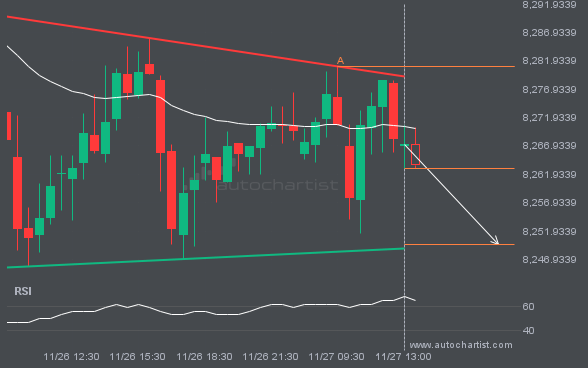
The movement of FTSE100 towards the support line of a Descending Triangle is yet another test of the line it reached numerous times in the past. This line test could happen in the next 5 hours, but it is uncertain whether it will result in a breakout through this line, or simply rebound back to current levels.
This trade setup on USDJPY formed after a period of consolidation, during which the price moved mostly sideways before choosing a longer-term direction. Following the bearish breakout through support, the price could move toward 153.6557.

An emerging Rising Wedge has been detected on XAUUSD. The pattern has not yet broken through support, but the price is expected to move up over the next few hours. At the time the pattern was found, the price was 4213.385, and it is expected to move to 4266.8382.

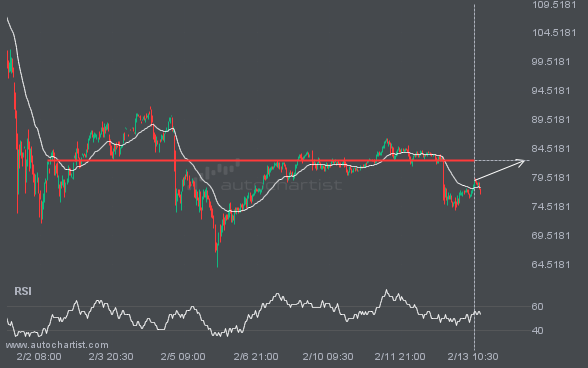
FTSE100 is moving toward a resistance line. Since it has retraced from this line before, we may see either a breakout through it or a rebound to current levels. It has touched this line multiple times in the past 9 days and may test it again within the next 12 hours.

A strong resistance level has been identified at 105504.8203 on the 15 Minutes BTCUSD chart. BTCUSD is likely to test this level soon.

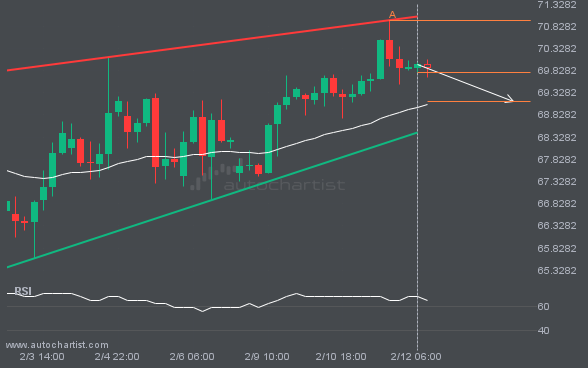
An emerging Rising Wedge pattern has been detected for S&P500 on the 1 hour chart. There may be a move toward 6908.0376 in the next few candles. Once it reaches the resistance, it may continue its bullish run or revert to current price levels.

LTCUSD is moving toward a support line. Because it has retraced from this level in the past, we may see either a breakout through this line or a rebound to current levels. It has touched this line multiple times over the last 9 days and may test it again within the next 2 days.

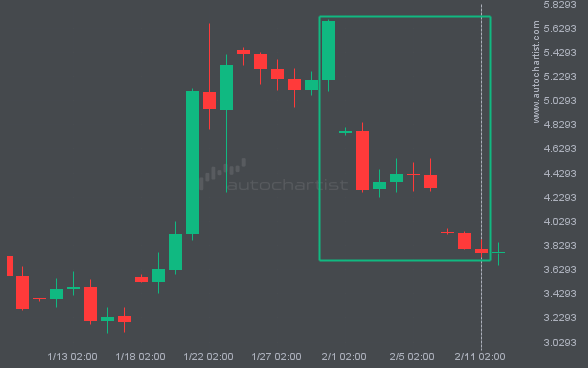
NGC/USD is moving toward a resistance line it has tested many times. It has retraced from this line before, so it’s unclear whether it will break through or rebound again. If NGC/USD continues on its current trajectory, it could reach 4.4504 within the next 19 hours.