MARKET ANALYSIS

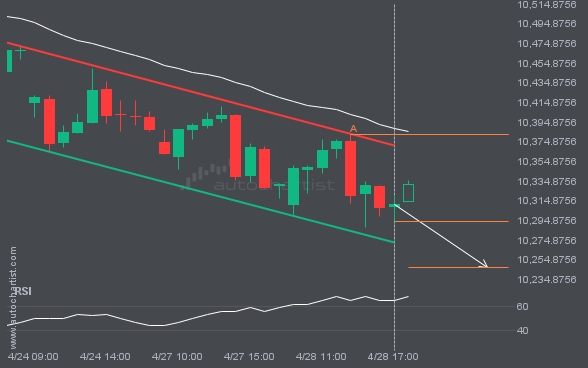
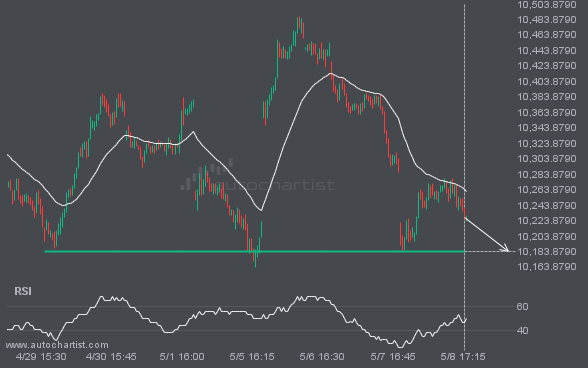
FTSE100 is heading toward the support line in a Channel Down pattern. If this move continues, the price of FTSE100 could test 10247.1785 within the next 7 hours. It has tested this line many times before, so the move could be short-lived and may rebound as it has before.

S&P500 has moved through the support line of a Rising Wedge pattern at 7176.299574468085 on the 1 hour chart. This line has been tested multiple times in the past, and this breakout could signal an upcoming change in the current trend. Price may continue in the current direction toward 7126.5572.

XAUUSD has broken through a line at 4668.5098. If this breakout holds, we could see the price of XAUUSD move toward 4599.9956 within the next 2 days. However, don’t be too quick to trade. It has tested this line many times in the past, so confirm the breakout before placing any trades.

LTCUSD is heading toward 54.7900 and could reach this level within the next 2 days. It has tested this level numerous times in the past, and this time could be no different, ending in a rebound rather than a breakout. If a breakout does not occur, we may see a retracement back to current levels.

NGC/USD is moving toward a resistance line. Because it has retraced from this level in the past, we may see either a breakout through this line or a rebound to current levels. It has touched this line multiple times over the last 15 days and may test it again within the next 3 days.

USDJPY is moving toward a resistance line. Because it has retraced from this level in the past, we may see either a breakout through this line or a rebound to current levels. It has touched this line multiple times over the last 5 days and may test it again within the next 12 hours.

An emerging Channel Up pattern in its final wave has been identified on the NAS100 4 hour chart. After a strong bullish run, NAS100 is heading toward the upper triangle trendline, with possible resistance at 28701.8878. If the resistance holds, the Channel Up pattern suggests a rebound toward current levels.

An emerging Falling Wedge pattern in its final wave has been identified on the XAGUSD 4 hour chart. After a strong bearish run, XAGUSD is heading toward the upper triangle trendline, with possible resistance at 71.6759. If the support holds, the Falling Wedge pattern suggests a rebound toward current levels.