Skip to content
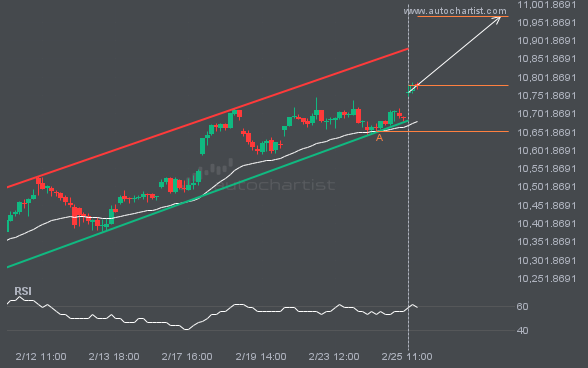
 FTSE100 is moving toward a resistance line it has tested many times. It has retraced from this line before, so it’s unclear whether it will break through or rebound again. If FTSE100 continues on its current trajectory, it could reach 10967.5713 within the next 2 days.