MARKET ANALYSIS

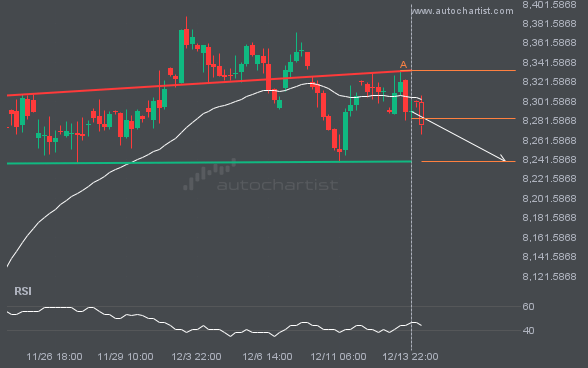
FTSE100 was identified at around 8284.15 having recently rebounded of the resistance on the 4 hour data interval. Ultimately, the price action of the stock has formed a Head and Shoulders pattern. This squeeze may increases the chances of a strong breakout. The projected movement will potentially take the price to around the 8239.7382 level.

GBPJPY is about to retest a key horizontal resistance level near 212.7880. It has tested this level 4 times recently and may simply bounce off it, as it did last time. However, after so many attempts, it may be ready to start a new trend.

BTCUSD is moving toward a resistance line. Because it has retraced from this level in the past, we may see either a breakout through this line or a rebound to current levels. It has touched this line multiple times over the last 8 days and may test it again within the next 2 days.

NAS100 is moving toward a resistance line. Since it has retraced from this line before, we may see either a breakout through this line or a rebound to current levels. It has touched this line numerous times in the last 12 days and may test it again within the next 3 days.

Falling Wedge pattern identified on ETHUSD has broken through a resistance level, with price momentum continuing to move upward. This presents a solid trading opportunity, with the price expected to reach 2189.2889 in the next 7.

The movement of BRN/USD towards the 99.6420 price line is yet another test of a line it has reached numerous times in the past. We can expect this test to occur within the next 2 days, but it is uncertain whether it will result in a breakout through this line or simply rebound to current […]

The movement of XAUUSD toward the resistance line of a Channel Down is yet another test of the line it has reached numerous times in the past. This test of the line could occur within the next 2 days, but it is uncertain whether it will result in a breakout through this line or simply […]

LTCUSD is moving toward a support line. Because it has retraced from this level in the past, we may see either a breakout through this line or a rebound to current levels. It has touched this line multiple times over the last 6 days and may test it again within the next 2 days.