The last 20 4 hour candles on FTSE100 have formed a Triangle pattern and broken out through the pattern lines, indicating a possible bullish movement toward the price level at 10243.9850.
 Skip to content
 The last 20 4 hour candles on FTSE100 have formed a Triangle pattern and broken out through the pattern lines, indicating a possible bullish movement toward the price level at 10243.9850.
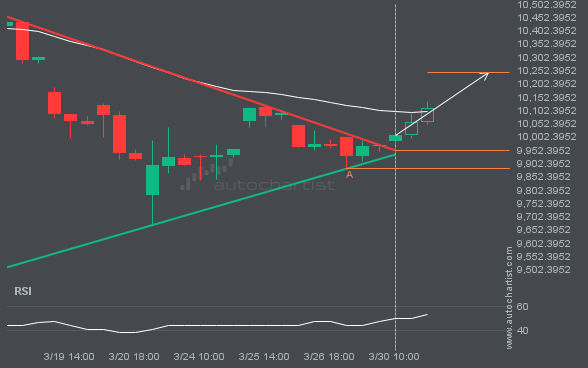
The last 20 4 hour candles on FTSE100 have formed a Triangle pattern and broken out through the pattern lines, indicating a possible bullish movement toward the price level at 10243.9850.
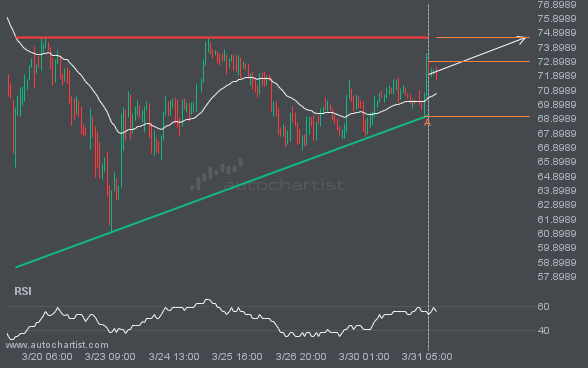
An emerging Ascending Triangle pattern in its final wave has been identified on the XAGUSD 1 hour chart. After a strong bullish run, XAGUSD is heading toward the upper triangle trendline, with possible resistance at 74.5846. If the resistance holds, the Ascending Triangle pattern suggests a rebound toward current levels.
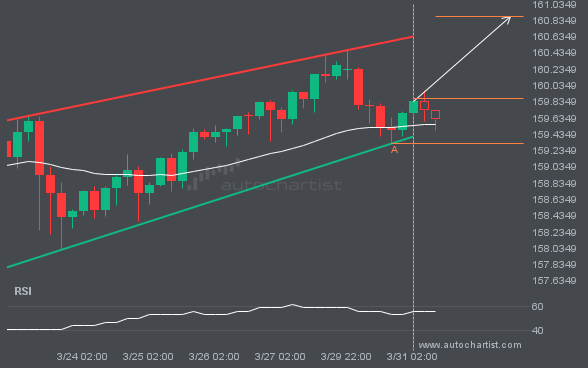
USDJPY is moving toward a resistance line. Since it has retraced from this line before, we may see either a breakout through it or a rebound to current levels. It has touched this line multiple times in the past 12 days and may test it again within the next 2 days.
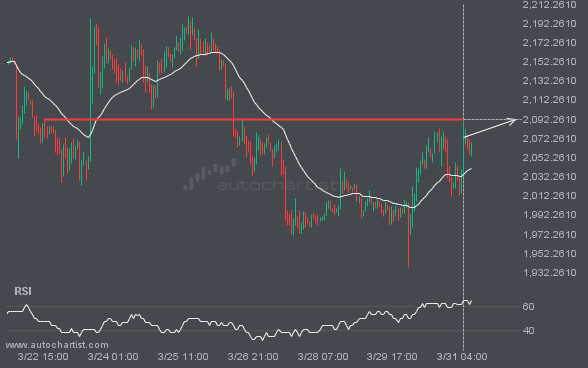
ETHUSD is heading toward 2092.2900 and could reach this level within the next 2 days. It has tested this level numerous times in the past, and this time could be no different, ending in a rebound rather than a breakout. If a breakout does not occur, we may see a retracement back to current levels.
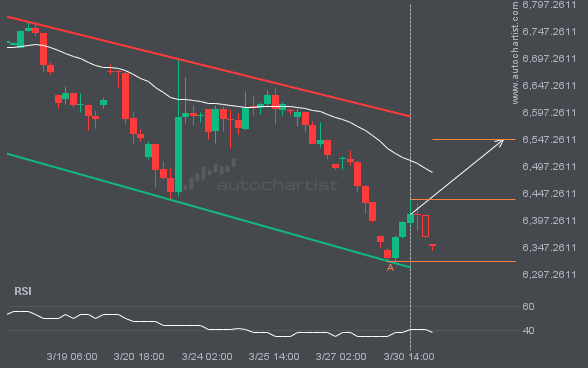
The movement of S&P500 toward the resistance line of a Channel Down is yet another test of the line it has reached numerous times in the past. This test of the line could occur within the next 3 days, but it is uncertain whether it will result in a breakout through this line or simply […]
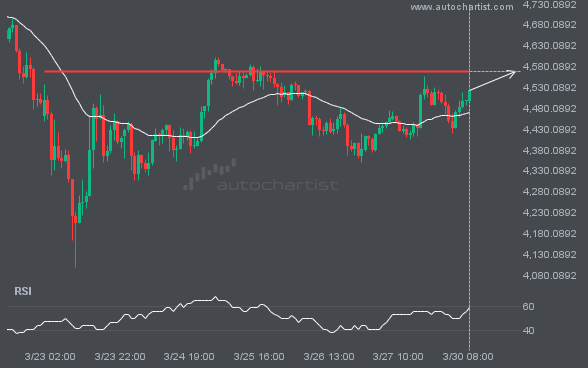
The movement of XAUUSD towards the 4569.0298 price line is yet another test of a line it has reached numerous times in the past. We can expect this test to occur within the next 2 days, but it is uncertain whether it will result in a breakout through this line or simply rebound to current […]
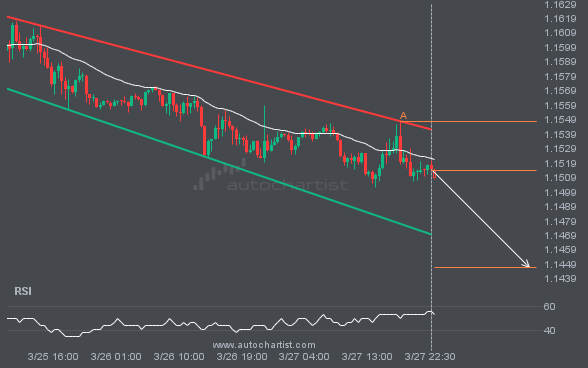
EURUSD is heading toward the support line of a Channel Down pattern and could reach it within the next 17 hours. It has tested this line numerous times before, and this time may be no different, ending in a rebound instead of a breakout. If a breakout doesn’t occur, we could see a retracement back […]