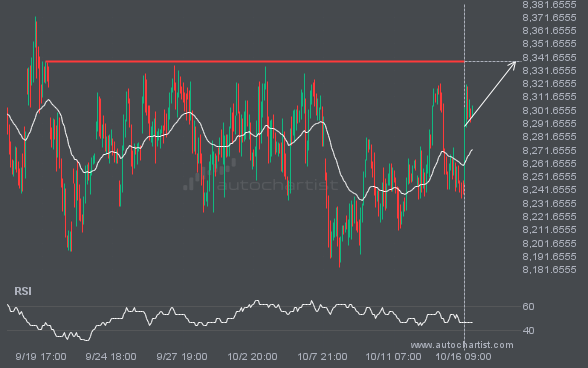
FTSE100 is moving towards a key resistance level at 8338.5996. This is a previously tested level for FTSE100. This could be a good trading opportunity, either at the spot price, or after breaching this level.
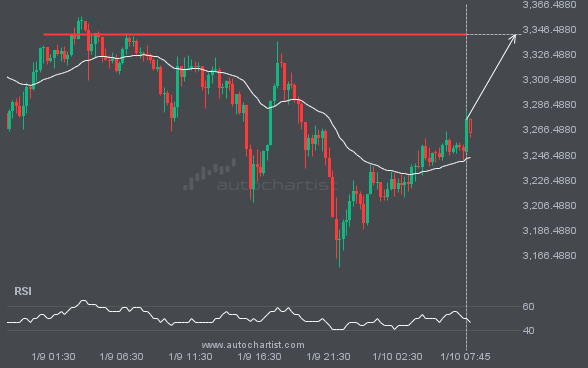
The price of ETHUSD in heading back to the resistance area. It is possible that it will struggle to break through it and move back in the other direction. The price may eventually break through, but typically the price retreats from the level a number of times before doing so.
NAS100 is moving towards a key resistance level at 21230.7598. This is a previously tested level for NAS100. This could be a good trading opportunity, either at the spot price, or after breaching this level.
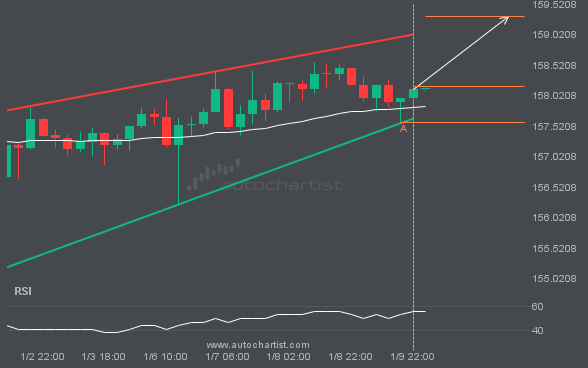
The movement of USDJPY towards the resistance line of a Rising Wedge is yet another test of the line it reached numerous times in the past. This line test could happen in the next 2 days, but it is uncertain whether it will result in a breakout through this line, or simply rebound back to […]
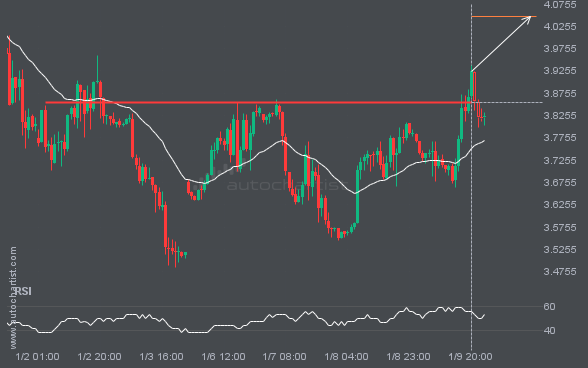
NGC/USD has breached the resistance line at 3.8555. It may continue the bullish trend towards 4.0474, or, it may prove to be yet another test of this level.
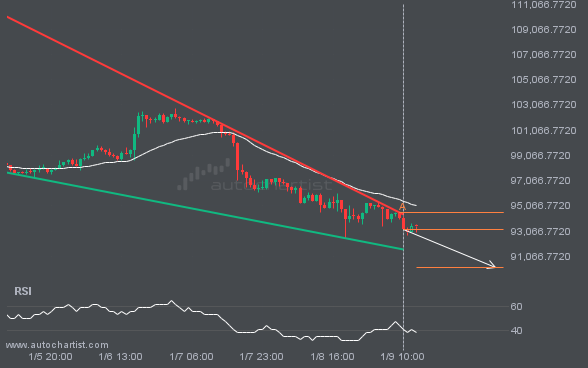
The movement of BTCUSD towards the support line of a Falling Wedge is yet another test of the line it reached numerous times in the past. This line test could happen in the next 2 days, but it is uncertain whether it will result in a breakout through this line, or simply rebound back to […]
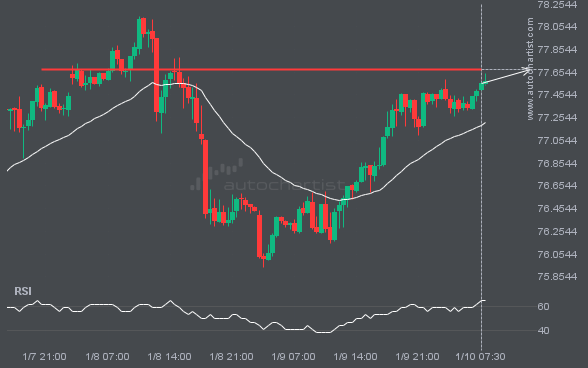
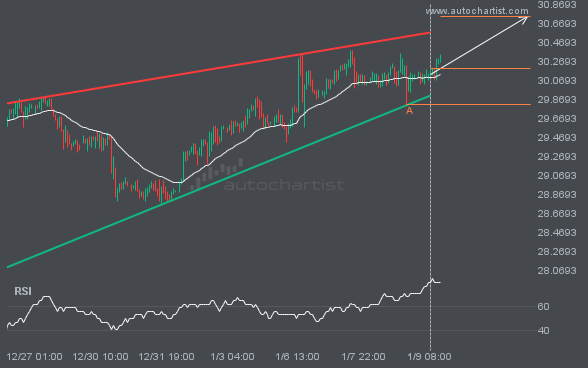
XAGUSD is moving towards a resistance line which it has tested numerous times in the past. We have seen it retrace from this line before, so at this stage it isn’t clear whether it will breach this line or rebound as it did before. If XAGUSD continues in its current trajectory, we could see it […]