MARKET ANALYSIS

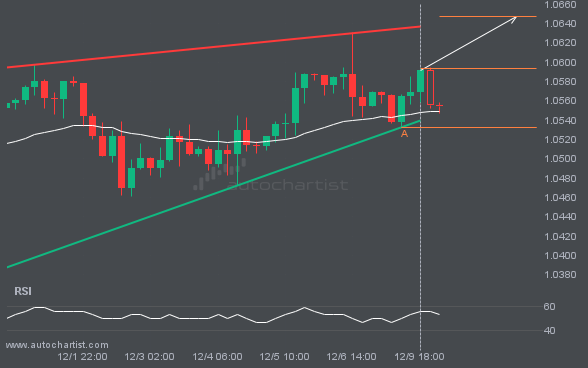
Emerging Rising Wedge detected on EURUSD – the pattern is an emerging one and has not yet broken through support, but the price is expected to move up over the next few hours. The price at the time the pattern was found was 1.05929 and it is expected to move to 1.0647.
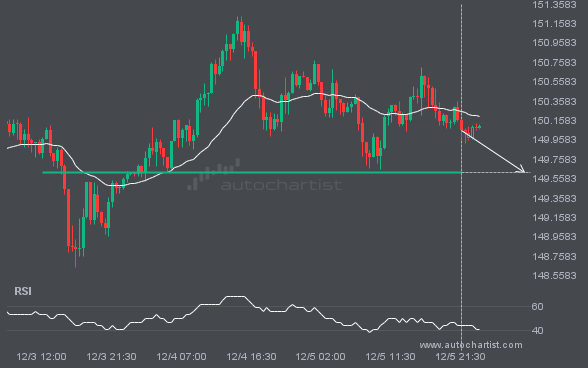
USDJPY is moving towards a key support level at 149.6260. USDJPY has previously tested this level 3 times and on each occasion it has bounced back off this level. Is this finally the time it will break through?

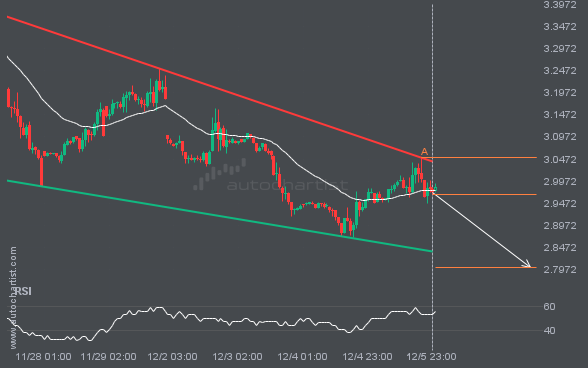
NGC/USD is approaching the support line of a Falling Wedge. It has touched this line numerous times in the last 10 days. If it tests this line again, it should do so in the next 2 days.

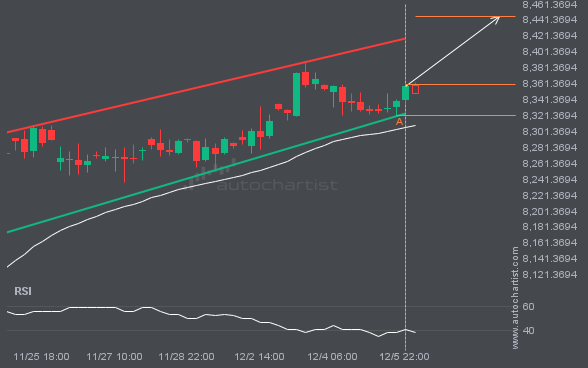
FTSE100 is moving towards a resistance line. Because we have seen it retrace from this line before, we could see either a break through this line, or a rebound back to current levels. It has touched this line numerous times in the last 15 days and may test it again within the next 3 days.

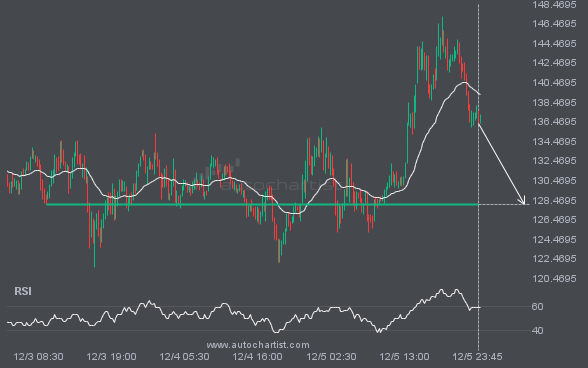
LTCUSD is moving towards a key support level at 128.0300. This is a previously tested level for LTCUSD. This could be a good trading opportunity, either at the spot price, or after breaching this level.

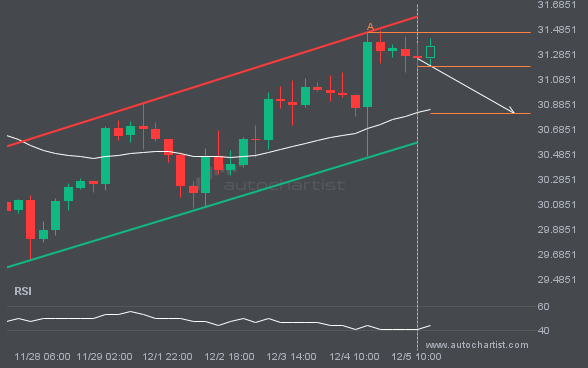
A Channel Up pattern was identified on XAGUSD at 31.187, creating an expectation that it may move to the support line at 30.8103. It may break through that line and continue the bearish trend or it may reverse from that line.

XAUUSD is heading towards the resistance line of a Channel Up. If this movement continues, the price of XAUUSD could test 2668.4056 within the next 7 hours. It has tested this line numerous times in the past, so this movement could be short-lived and end up rebounding just like it did in the past.

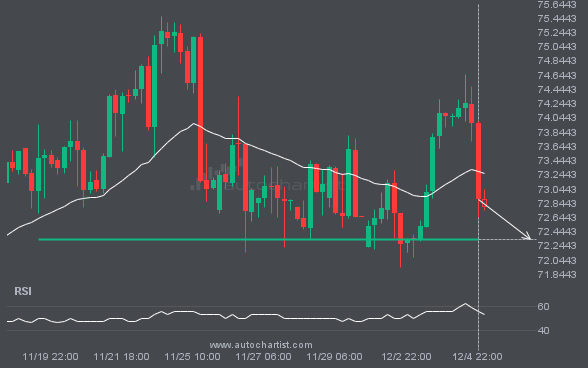
BRN/USD is heading towards 72.3395 and could reach this point within the next 3 days. It has tested this line numerous times in the past, and this time could be no different, ending in a rebound instead of a breakout. If the breakout doesn’t happen, we could see a retracement back down to current levels.