MARKET ANALYSIS

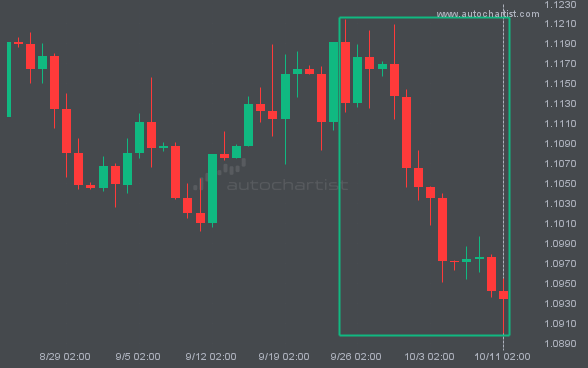
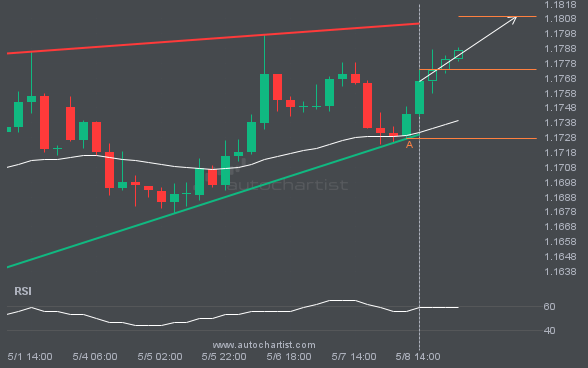
For those of you that don’t believe in trends, this may be an opportunity to take advantage of an exceptional 1.76% move on EURUSD. The movement has happened over the last 17 days. For those trend followers among you, you may think about riding this possible trend.

S&P500 just posted a 2.99% move over the past 4 days—a move unlikely to go unnoticed by any trading style.

NAS100 is moving toward a resistance line. Since it has retraced from this line before, we may see either a breakout through this line or a rebound to current levels. It has touched this line numerous times in the last 4 days and may test it again within the next 18 hours.

GBPJPY is about to retest a key horizontal resistance level near 212.8815. It has tested this level 6 times recently and may simply bounce off it, as it did last time. However, after so many attempts, it may be ready to start a new trend.

An emerging Channel Down pattern in its final wave has been identified on the XAGUSD 1 hour chart. After a strong bearish run, XAGUSD is heading toward the upper triangle trendline, with possible resistance at 56.9514. If the support holds, the Channel Down pattern suggests a rebound toward current levels.

LTCUSD has broken through 54.4100, which it has tested many times before. We have also seen it retrace from this level. If this new trend persists, LTCUSD may be heading towards 52.4400 within the next 3 days.

The movement of FTSE100 toward the support line of a Falling Wedge is yet another test of the line it has reached numerous times in the past. This test of the line could occur within the next 12 hours, but it is uncertain whether it will result in a breakout through this line or simply […]

LTCUSD is approaching the line at 55.1300. If this move continues, the price of LTCUSD could test 55.1300 within the next 2 days. But do not rush to trade. It has tested this line many times in the past, so the move could be short-lived and end in a rebound.