MARKET ANALYSIS

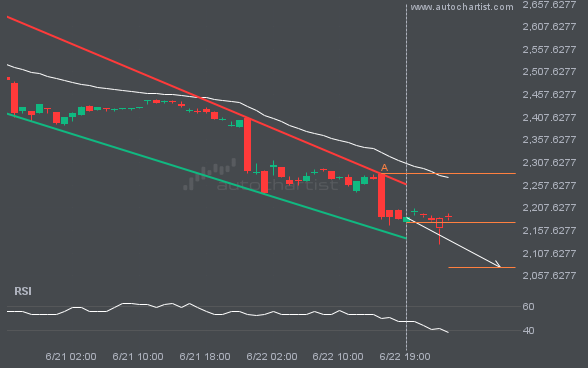
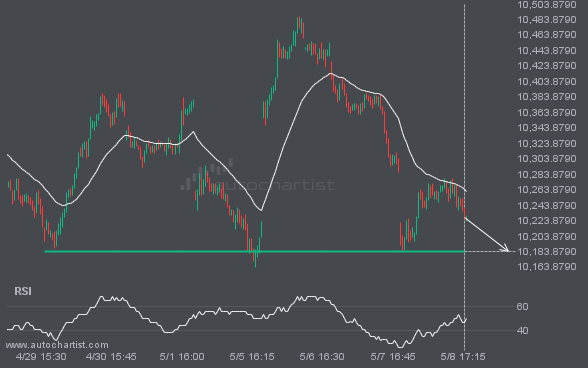
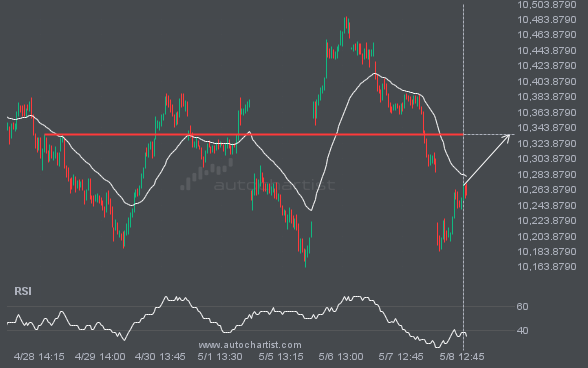
ETHUSD is moving towards a support line which it has tested numerous times in the past. We have seen it retrace from this line before, so at this stage it isn’t clear whether it will breach this line or rebound as it did before. If ETHUSD continues in its current trajectory, we could see it reach 2076.1199 within the next 9 hours.

BRN/USD is approaching a support line at 74.3240. If it hits the support line, it may break through this level to continue the bearish trend, or it may turn around back to current levels.

ETHUSD is moving towards a support line. Because we have seen it retrace from this line before, we could see either a break through this line, or a rebound back to current levels. It has touched this line numerous times in the last 9 days and may test it again within the next 2 days.

Emerging Falling Wedge pattern in its final wave was identified on the FTSE100 15 Minutes chart. After a strong bearish run, we find FTSE100 heading towards the upper triangle line with a possible resistance at 8778.4935. If the support shows to hold, the Falling Wedge pattern suggests a rebound back towards current levels.

XAGUSD is heading towards a line of 35.9149. If this movement continues, the price of XAGUSD could test 35.9149 within the next 2 days. But don’t be so quick to trade, it has tested this line numerous times in the past, so this movement could be short-lived and end up rebounding.

Emerging Channel Up pattern in its final wave was identified on the GBPJPY 4 hour chart. After a strong bullish run, we find GBPJPY heading towards the upper triangle line with a possible resistance at 197.1709. If the resistance shows to hold, the Channel Up pattern suggests a rebound back towards current levels.

XAUUSD has broken through a support line. Because we have seen it retrace from this price in the past, one should wait for confirmation of the breakout before trading. It has touched this line numerous times in the last 15 days and suggests a possible target level to be around 3310.7151 within the next 3 […]

The movement of LTCUSD towards 85.9000 price line is yet another test of the line it reached numerous times in the past. We could expect this test to happen in the next 2 days, but it is uncertain whether it will result in a breakout through this line, or simply rebound back to current lines.