Skip to content
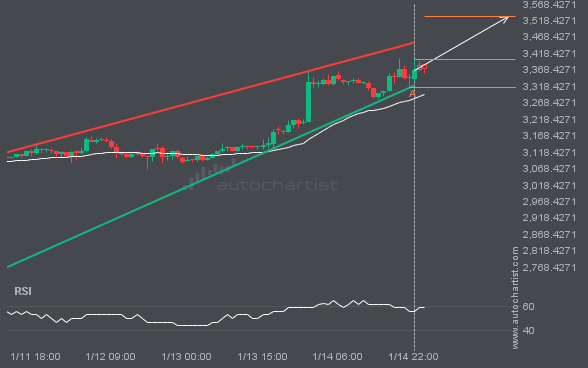
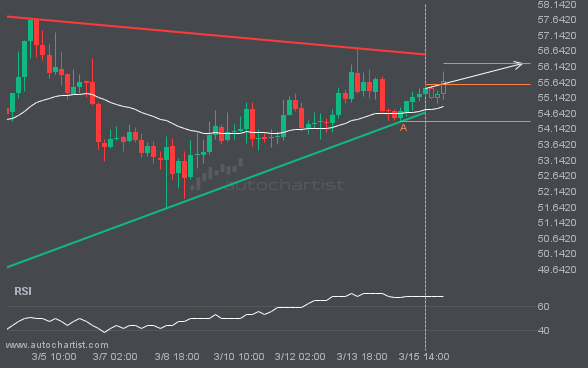
 An emerging Rising Wedge pattern in its final wave has been identified on the ETHUSD 1 hour chart. After a strong bullish run, ETHUSD is heading toward the upper triangle trendline, with possible resistance at 3530.3131. If the resistance holds, the Rising Wedge pattern suggests a rebound toward current levels.