...
MARKET ANALYSIS

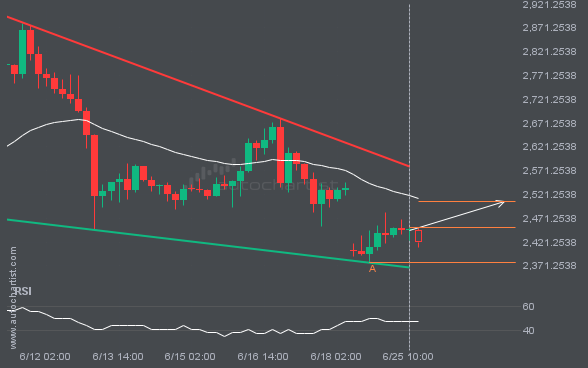
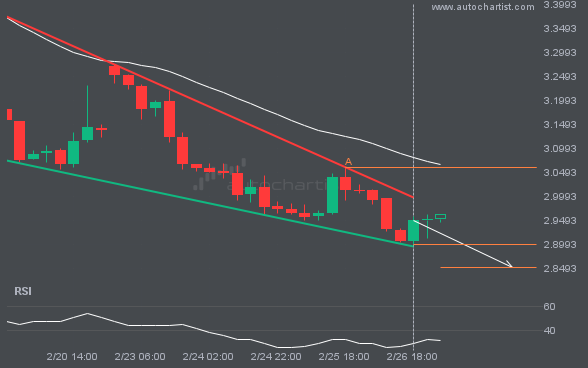
ETHUSD was identified at around 2452.05 having recently rebounded of the support on the 4 hour data interval. Ultimately, the price action of the stock has formed a Falling Wedge pattern. This squeeze may increases the chances of a strong breakout. The projected movement will potentially take the price to around the 2507.1869 level.

XAUUSD is moving toward a resistance line. Since it has retraced from this line before, we may see either a breakout through it or a rebound to current levels. It has touched this line multiple times in the past 10 days and may test it again within the next 2 days.

S&P500 recorded an unusual number of bullish candles on the 4 hour timeframe.

LTCUSD has broken through a line at 76.2300. If this breakout holds, we could see the price of LTCUSD move toward 73.4370 within the next 2 days. However, don’t be too quick to trade. It has tested this line many times in the past, so confirm the breakout before placing any trades.

The last 3 15 Minutes candles on LTCUSD have formed a Channel Down pattern and broken out through the pattern lines, indicating a possible bullish movement toward the price level at 77.1613.

XAUUSD has broken through the support line, which it has tested twice before. We have seen it retrace from this line before, so wait for confirmation of the breakout before trading. If this new trend persists, a target level around 4295.5352 may materialize within the next 2 days.

A movement of 1.06% over 12 hours on GBPJPY does not go unnoticed. You may want to consider where it is heading next: a continuation of the current upward trend or a reversal of the prior trend.