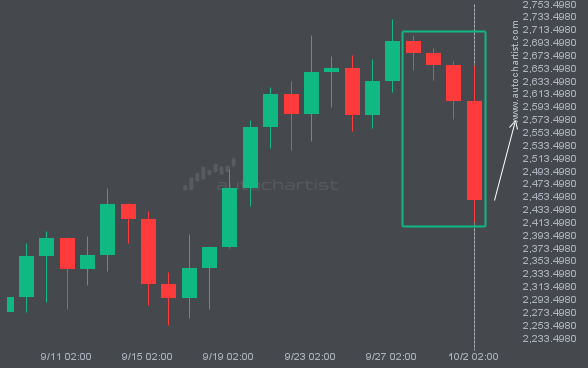
Due to the rate of consecutive bearish candles on ETHUSD Daily chart we could be in for a price correction. If not, this trend could be a sign of things to come
 Skip to content
 Due to the rate of consecutive bearish candles on ETHUSD Daily chart we could be in for a price correction. If not, this trend could be a sign of things to come
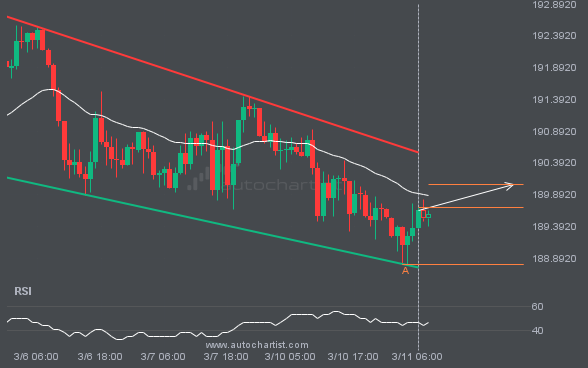
GBPJPY is approaching the resistance line of a Channel Down. It has touched this line numerous times in the last 6 days. If it tests this line again, it should do so in the next 21 hours.
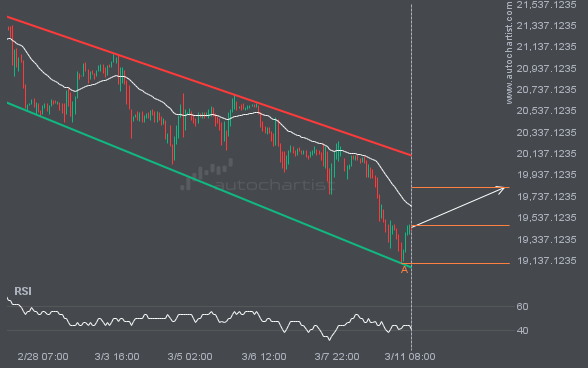
NAS100 is moving towards a resistance line which it has tested numerous times in the past. We have seen it retrace from this line before, so at this stage it isn’t clear whether it will breach this line or rebound as it did before. If NAS100 continues in its current trajectory, we could see it […]
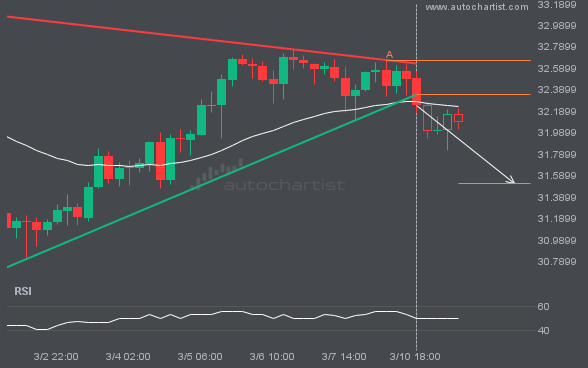
The last 13 4 hour candles on XAGUSD formed a Triangle pattern and broken out through the pattern lines, indicating a possible bearish movement towards the price level of 31.5155.
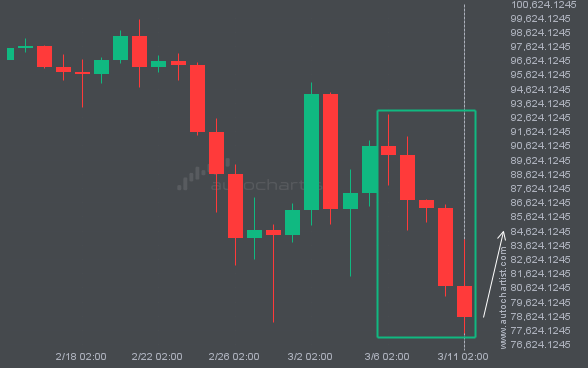
Trend followers are probably eagerly watching BTCUSD to see if its latest 5 consecutive candles continues. If not, the mean-reversion people out there will be delighted with this exceptionally large 6 day move.

BRN/USD is moving towards a support line. Because we have seen it retrace from this line before, we could see either a break through this line, or a rebound back to current levels. It has touched this line numerous times in the last 14 days and may test it again within the next 3 days.
FTSE100 is moving towards a support line. Because we have seen it retrace from this line before, we could see either a break through this line, or a rebound back to current levels. It has touched this line numerous times in the last 15 days and may test it again within the next 2 days.

EURUSD has broken through a support line of a Triangle chart pattern. If this breakout holds true, we may see the price of EURUSD testing 1.0810 within the next 8 hours. But don’t be so quick to trade, it has tested this line in the past, so you should confirm the breakout before taking any […]