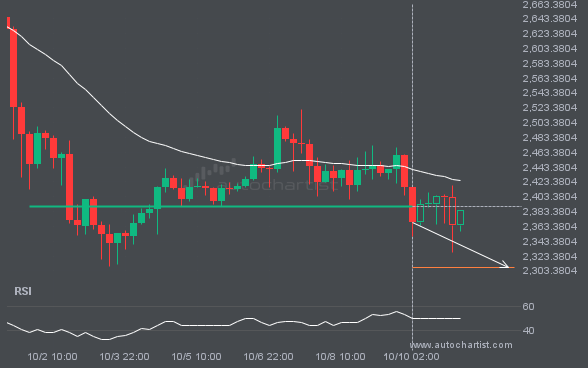
ETHUSD is once again retesting a key horizontal support level at 2389.8601. It has tested this level 5 times in the recent past and could simply bounce off like it did last time. However, after this many tries, maybe it’s ready to start a new trend.
 Skip to content
 ETHUSD is once again retesting a key horizontal support level at 2389.8601. It has tested this level 5 times in the recent past and could simply bounce off like it did last time. However, after this many tries, maybe it’s ready to start a new trend.
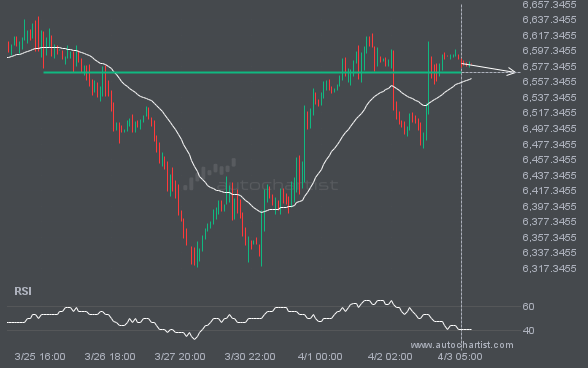
S&P500 is approaching a support line at 6569.7998. If it hits the support line, it may break through this level to continue the bearish trend, or it may return to current levels.
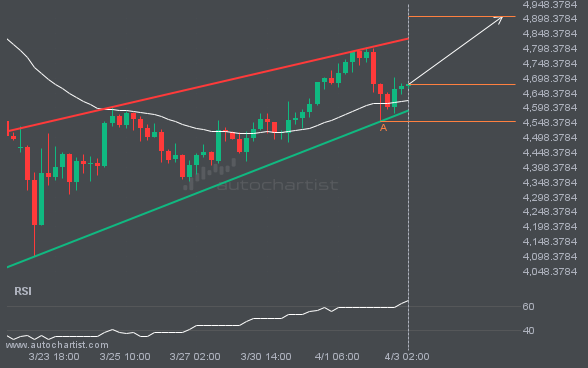
XAUUSD is moving toward a resistance line it has tested many times. It has retraced from this line before, so it’s unclear whether it will break through or rebound again. If XAUUSD continues on its current trajectory, it could reach 4906.1557 within the next 3 days.
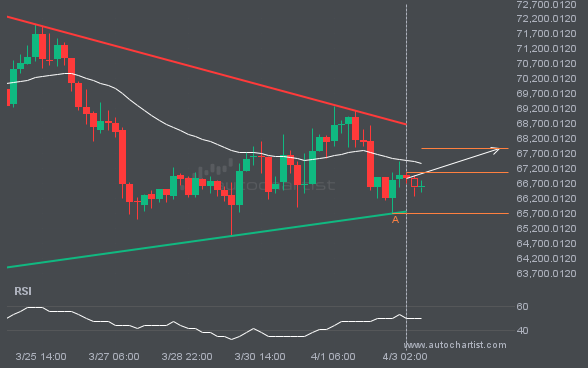
An emerging Triangle pattern has been detected for BTCUSD on the 4 hour chart. There may be a move toward 67868.3611 in the next few candles. Once it reaches the resistance, it may continue its bullish run or revert to current price levels.
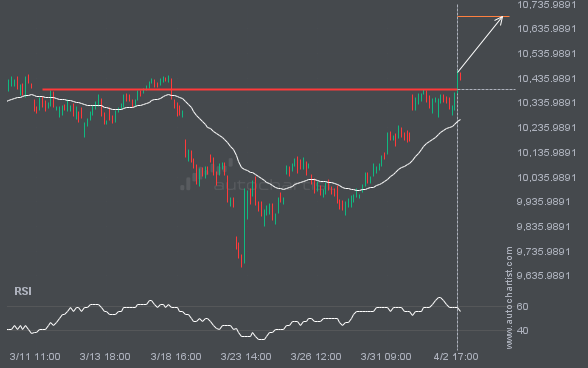
FTSE100 has broken through a resistance line. Because it has previously retraced from this price, you should wait for confirmation of the breakout before trading. It has touched this line multiple times over the past 23 days, which suggests a possible target around 10685.2363 within the next 2 days.

Triangle pattern identified on BRN/USD has broken through a resistance level, with price momentum continuing to move upward. This presents a solid trading opportunity, with the price expected to reach 118.6933 in the next 3.
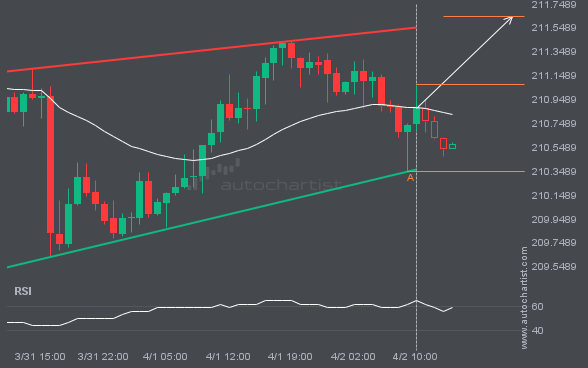
The movement of GBPJPY toward the resistance line of a Rising Wedge is yet another test of the line it has reached numerous times in the past. This test of the line could occur within the next 10 hours, but it is uncertain whether it will result in a breakout through this line or simply […]
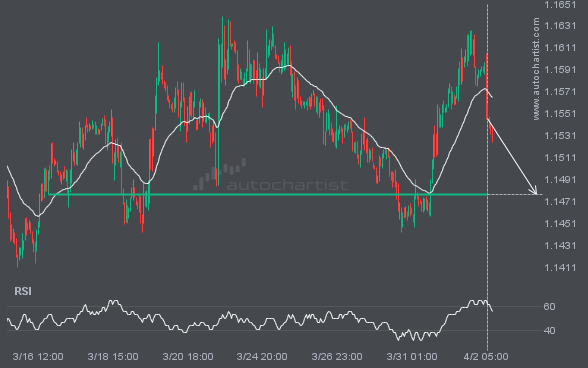
EURUSD is approaching a support line at 1.1478. If it hits the support line, it may break through this level to continue the bearish trend, or it may return to current levels.