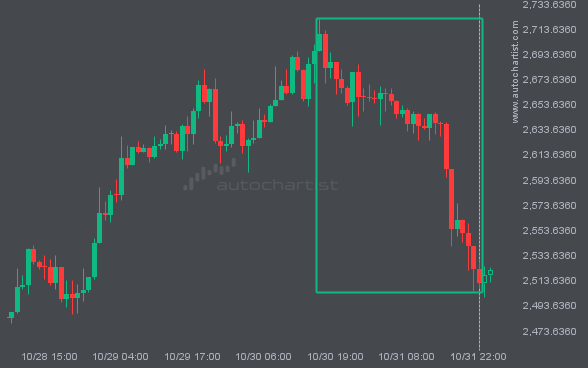
ETHUSD experienced an extremely large move that lasted 2. This movement is in the 2.0 percentile and is uncommon. It is not unusual to witness a pullback after such a big movement.
 Skip to content
 ETHUSD experienced an extremely large move that lasted 2. This movement is in the 2.0 percentile and is uncommon. It is not unusual to witness a pullback after such a big movement.
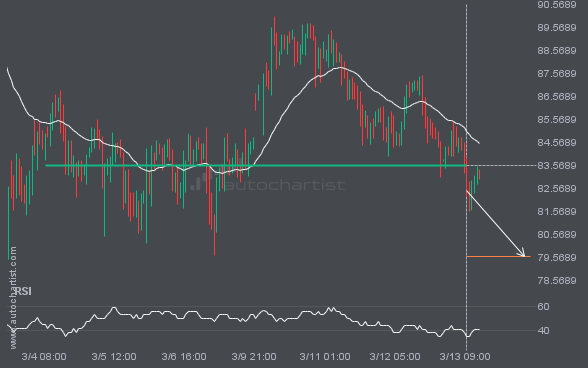
XAGUSD has broken through a line at 83.5743. If this breakout holds, we could see the price of XAGUSD move toward 79.6348 within the next 2 days. However, don’t be too quick to trade. It has tested this line many times in the past, so confirm the breakout before placing any trades.
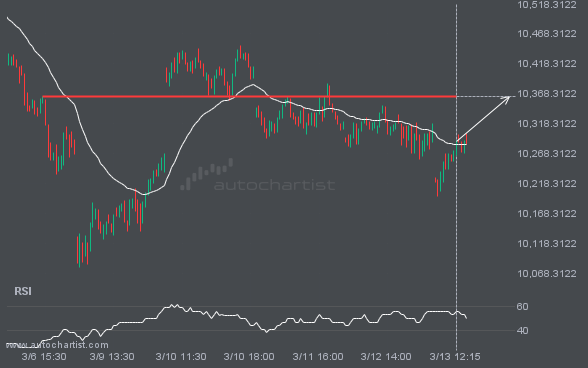
FTSE100 is approaching a resistance line at 10363.5498. If it hits the resistance line, it may break through this level to continue the bullish trend, or it may return to current levels.
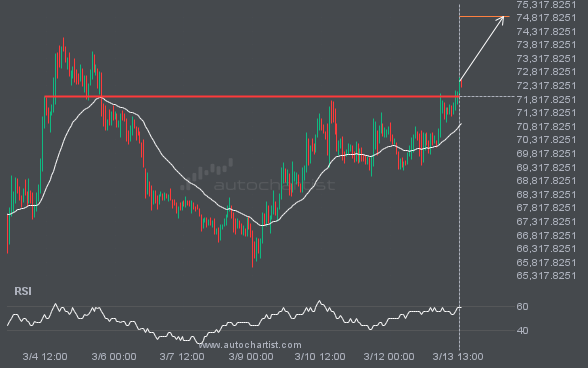
BTCUSD is once again retesting a key horizontal resistance level at 71902.8125. This level has been tested 3 times recently and could see another bounce, as it did last time. However, after so many attempts, it may be ready to start a new trend.
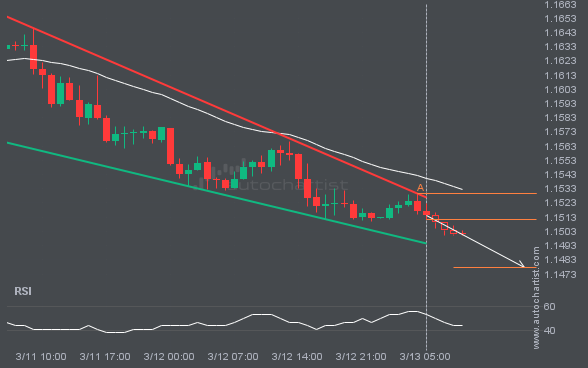
A Falling Wedge pattern was identified for EURUSD at 1.15112, suggesting it may move toward the support line at 1.1477. It may break through that line and continue the bearish trend, or reverse from it.
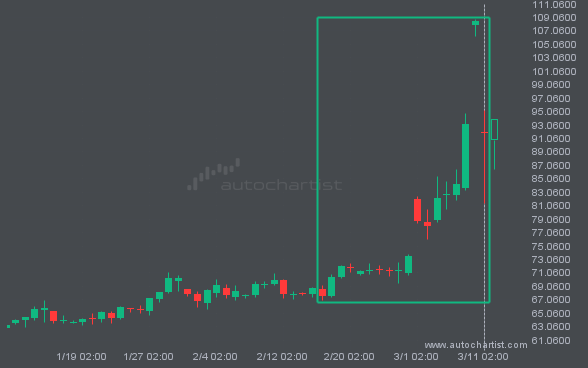
BRN/USD has moved higher by 35.87% from 67.5235 to 91.745 in the last 23 days.
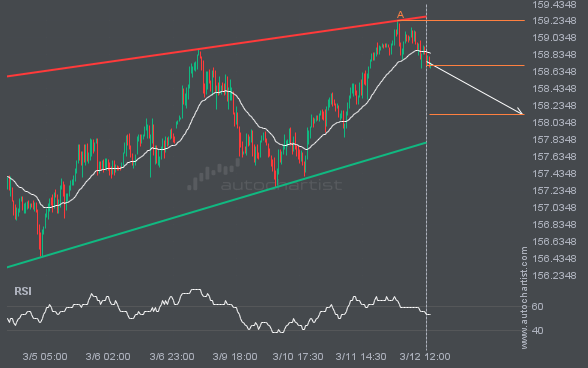
The movement of USDJPY toward the support line of a Rising Wedge is yet another test of the line it has reached numerous times in the past. This test of the line could occur within the next 2 days, but it is uncertain whether it will result in a breakout through this line or simply […]
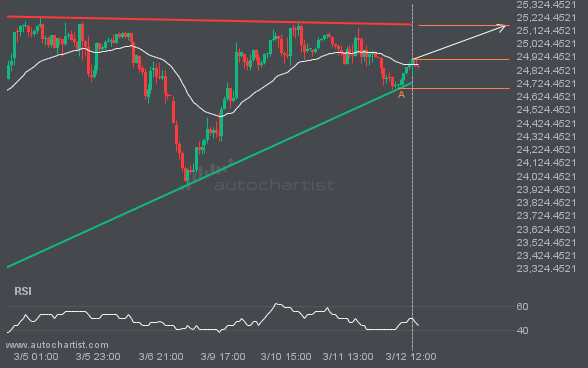
NAS100 is heading toward the resistance line of a Ascending Triangle pattern and could reach it within the next 2 days. It has tested this line numerous times before, and this time may be no different, ending in a rebound instead of a breakout. If a breakout doesn’t occur, we could see a retracement back […]