CPattern and Autochartist are proud to announce a joint technology collaboration to enable professional content personalization for traders. This technology
Autochartist, a leading global fintech provider, is proud to announce the launch of its innovative content personalization solutions. The new solutions offer online brokers the opportunity to deliver personalized content based on trader behavior such as traded instruments, hours of activity, trading style, and risk profile. The development of the solution comes as a result […]
With the addition of Autochartist to ATFX’s WeChat, traders from all levels can learn how to set their stop-loss and take-profit orders based on analysis of an asset’s volatility. The global award-winning broker ATFX has just added Autochartist analytics and actionable content to their official WeChat account. Autochartist is a program which can identify chart […]
LeapRate Exclusive… ATFX has just announced that it has teamed up with the automated market analysis software provider Autochartist to offer trading analysis to its clients in China. Autochartist offers market analysis in 28 different languages, which combined with more than 14 languages that ATFX already offers, will give ATFX clients a wide range of language […]
Trade29 is delighted to announce the availability of “C1 Analyzer Pro” for “Sierra Chart”. Powered by Autochartist, the product consists of a set of studies that can be used on 25+ futures markets. This has been a joint collaboration between Autochartist, Infinity Futures and Trade29 Software. Our initial motivation for this work was the quality […]
One of Turkey’s largest domestic banks, IS Bank has launched the Autochartist market analysis service within its mobile application, making them the first Turkish financial institution to service Autochartist customers directly on Mobile. Autochartist, an award-winning provider of financial market analysis has been integrated into the IS Bank’s mobile application to make the trading process […]
20 Feb 2018 – Autochartist is proud to announce that it has concluded acquisition of a controlling stake in VerifyMyTrade – www.verifymytrade.com – a company specializing in measuring the quality of execution in the retail forex market. The VerifyMyTrade Trust Builder enables traders to verify, via an industry acknowledged impartial service provider, whether the price they receive […]
Daily Top Trade Setups: Advanced Forex, Indices, Commodities, and Stock Analysis
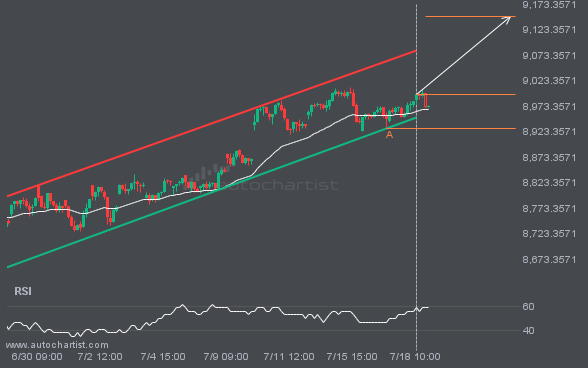
After testing the resistance line numerous times, FTSE100 is once again approaching this line. Can we expect a bullish trend to follow?
FTSE100 is moving towards a resistance line which it has tested numerous times in the past. We have seen it retrace from this line before, so at this stage it isn’t clear whether it will breach this line or rebound as it did before. If FTSE100 continues in its current trajectory, we could see it […]
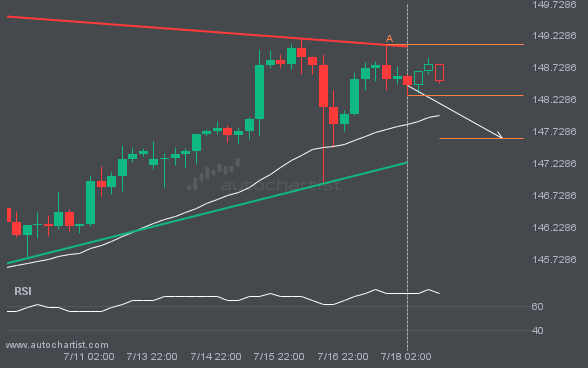
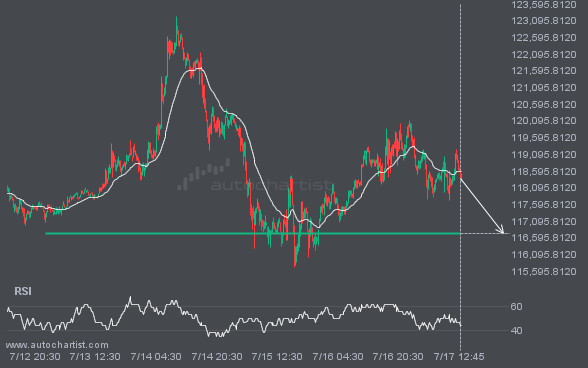
USDJPY – approaching a support line that has been previously tested at least twice in the past
USDJPY is heading towards the support line of a Triangle. If this movement continues, the price of USDJPY could test 147.6165 within the next 2 days. It has tested this line numerous times in the past, so this movement could be short-lived and end up rebounding just like it did in the past.
NGC/USD is quickly approaching the resistance line of a Rising Wedge. We expect either a breakout through this line or a rebound.
NGC/USD is trapped in a Rising Wedge formation, implying that a breakout is Imminent. This is a great trade-setup for both trend and swing traders. It is now approaching a support line that has been tested in the past. Divergence opportunists may be very optimistic about a possible breakout and this may be the start […]
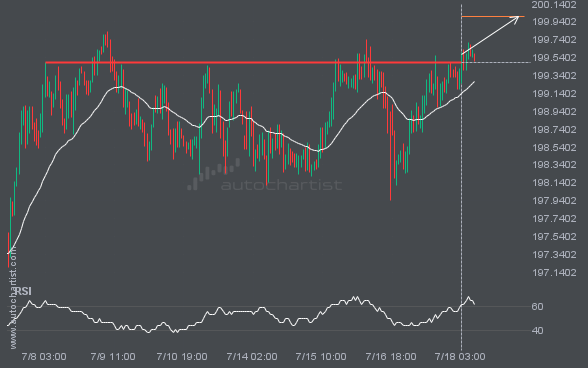
GBPJPY – breach of price line that’s been previously tested numerous times before
A strong resistance level has been breached at 199.4810 on the 1 hour GBPJPY chart. Technical Analysis theory forecasts a movement to 199.9998 in the next 2 days.
BRN/USD has broken through a level it has tested 7 times in the recent past.
BRN/USD is once again retesting a key horizontal resistance level at 69.6055. It has tested this level 7 times in the recent past and could simply bounce off like it did last time. However, after this many tries, maybe it’s ready to start a new trend.
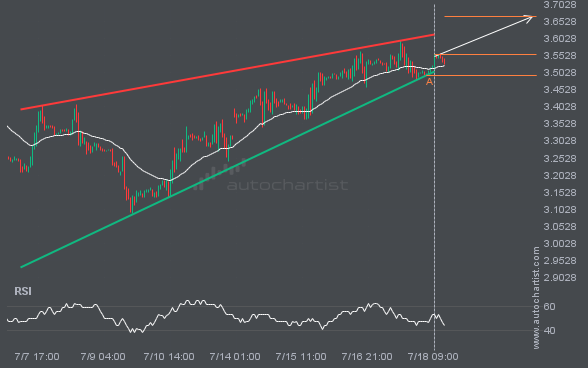
A possible move on ETHUSD as it heads towards resistance
A Channel Up pattern was identified on ETHUSD at 3504.18, creating an expectation that it may move to the resistance line at 3693.7448. It may break through that line and continue the bullish trend or it may reverse from that line.
BTCUSD keeps moving closer towards 116713.6797. Will it finally breach this level?
BTCUSD is heading towards a line of 116713.6797. If this movement continues, the price of BTCUSD could test 116713.6797 within the next 2 days. But don’t be so quick to trade, it has tested this line numerous times in the past, so this movement could be short-lived and end up rebounding.
Interesting trading articles, ideas, and thought leadership
If you’ve ever searched “Why is trading so hard?”, you’re not alone. It’s one of the most frequently asked questions on Google search related to the term “trading.” Whether you’re a beginner trying to find your footing or a seasoned trader struggling with consistency, the challenges of trading are undeniable. The financial markets offer endless […]
Have you ever found yourself in a conversation about the economy and struggled to keep up? Maybe you’ve heard terms like inflation, GDP, or interest rates thrown around but weren’t quite sure how they apply to your daily life. If so, you’re not alone. Many people avoid financial news because it’s full of jargon that […]
Would you expect a plumber to do his job effectively without the right tools? Probably not! Similarly, trader tools accessibility is crucial for effective trading. It’s easy to forget that traders also need tools to do their work. Market analysis, risk management, news sentiment analysis, and insights into historical data are all essential for enabling more […]
While the creator economy traditionally focuses on lifestyle, fashion, and entertainment, financial influencers are becoming increasingly popular on social media platforms. For better or worse, these creators affect how retail traders approach the markets. Platforms like TikTok, YouTube, and Instagram have become hotbeds for financial advice, with creators posting everything from stock tips to explanations […]
Today’s financial markets are increasingly competitive. Investors are always looking for ways to generate alpha—the measure of an investment’s performance relative to the market. One approach that has gained significant attention is the use of alternative data. However, this data – sourced from non-traditional avenues like social media sentiment, satellite imagery, or credit card transactions […]
High-frequency trading (HFT) has transformed financial markets over the past two decades. Using advanced algorithms and ultra-fast computers, HFT allows traders to execute thousands of trades in milliseconds. While HFT has brought benefits like enhanced market liquidity and tighter bid-ask spreads, it has also raised concerns about market stability, fairness, and ethical trading practices. This […]