Skip to content
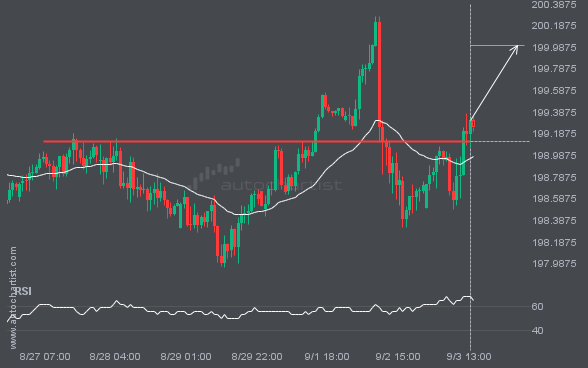
 GBPJPY has broken through 199.1180 which it has tested numerous times in the past. We have seen it retrace from this price in the past. If this new trend persists, GBPJPY may be heading towards 200.0020 within the next 2 days.
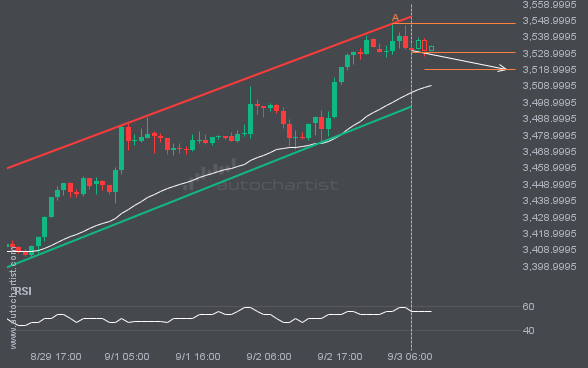
Emerging Channel Up pattern in its final wave was identified on the XAUUSD 1 hour chart. After a strong bearish run, we find XAUUSD heading towards the upper triangle line with a possible resistance at 3519.2064. If the support shows to hold, the Channel Up pattern suggests a rebound back towards current levels.
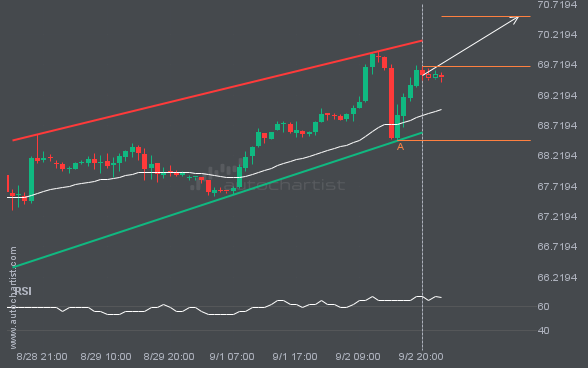
BRN/USD is heading towards the resistance line of a Channel Up. If this movement continues, the price of BRN/USD could test 70.5128 within the next 16 hours. It has tested this line numerous times in the past, so this movement could be short-lived and end up rebounding just like it did in the past.
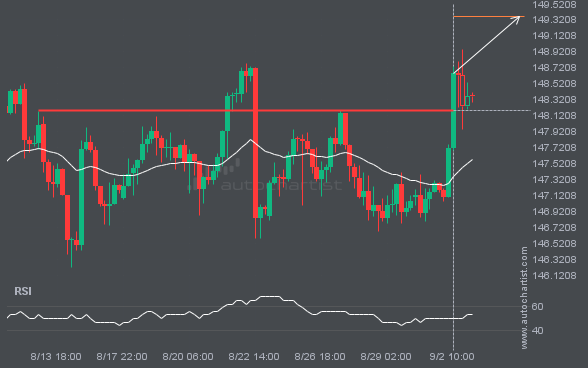
USDJPY has broken through a line of 148.1850 and suggests a possible movement to 149.3634 within the next 3 days. It has tested this line numerous times in the past, so one should wait for a confirmation of this breakout before taking any action. If the breakout doesn’t confirm, we could see a retracement back […]
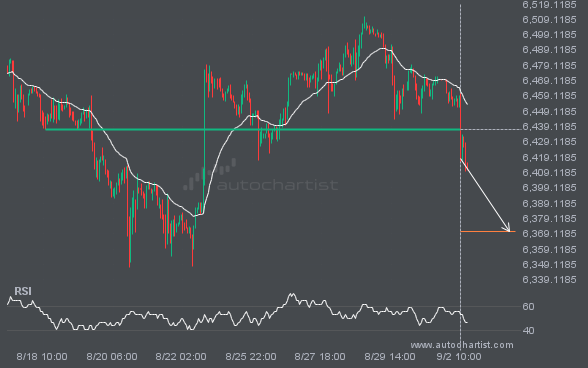
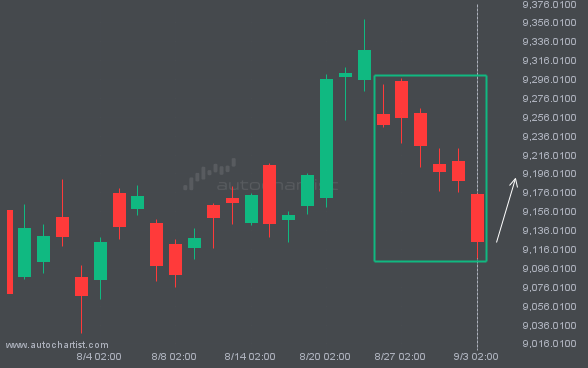
S&P500 has broken through a support line. It has touched this line numerous times in the last 15 days. This breakout shows a potential move to 6370.5698 within the next 3 days. Because we have seen it retrace from this level in the past, one should wait for confirmation of the breakout.
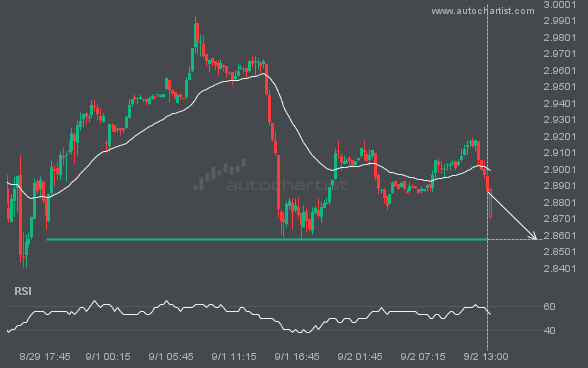
The price of NGC/USD in heading back to the support area. It is possible that it will struggle to break through it and move back in the other direction. The price may eventually break through, but typically the price retreats from the level a number of times before doing so.