 Skip to content
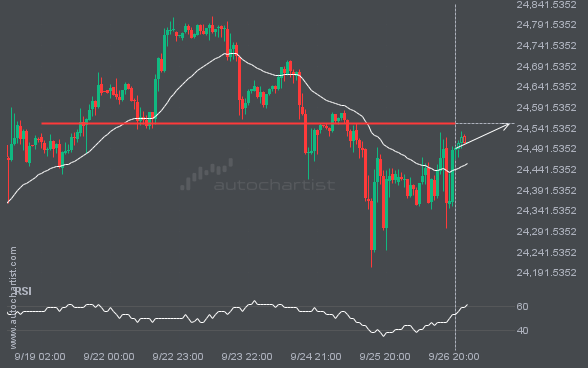
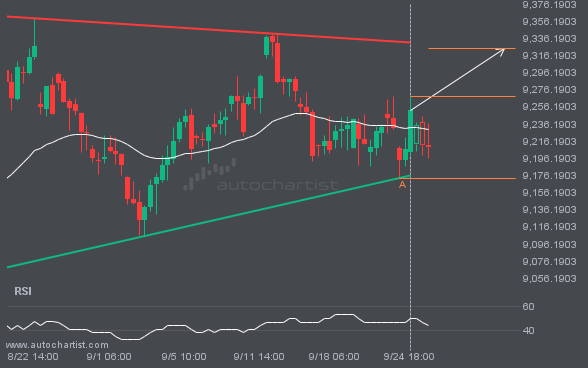
 NAS100 is moving towards a resistance line. Because we have seen it retrace from this level in the past, we could see either a break through this line, or a rebound back to current levels. It has touched this line numerous times in the last 8 days and may test it again within the next […]
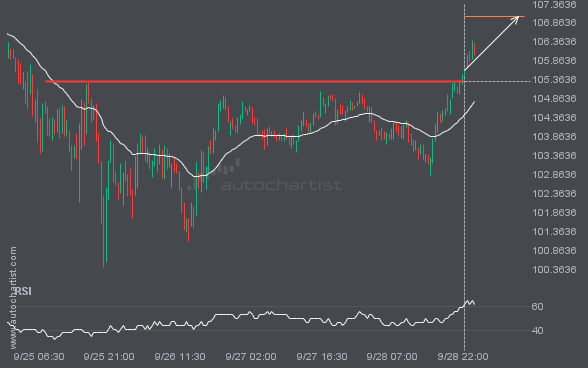
LTCUSD has broken through a line of 105.3100 and suggests a possible movement to 107.0330 within the next 19 hours. It has tested this line numerous times in the past, so one should wait for a confirmation of this breakout before taking any action. If the breakout doesn’t confirm, we could see a retracement back […]
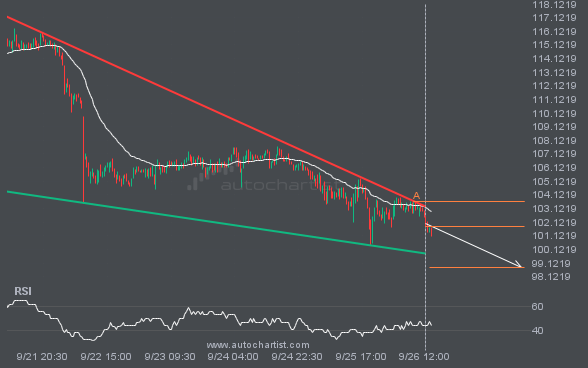
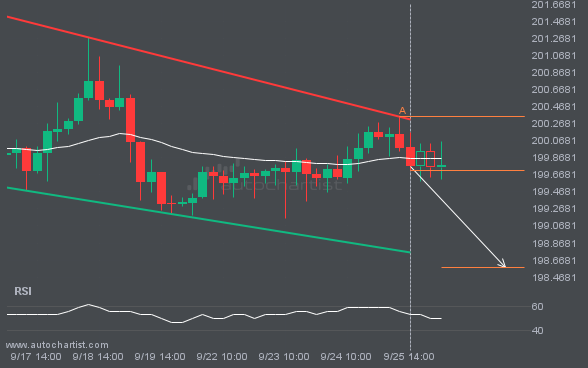
LTCUSD was identified at around 101.83 having recently rebounded of the resistance on the 30 Minutes data interval. Ultimately, the price action of the stock has formed a Falling Wedge pattern. This squeeze may increases the chances of a strong breakout. The projected movement will potentially take the price to around the 98.7964 level.
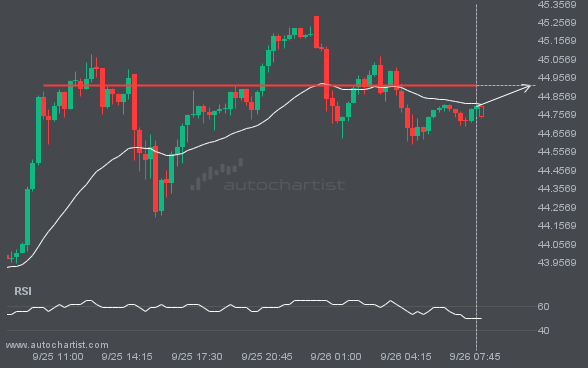
XAGUSD is en route to a very important line that will be a definite deciding factor of what is to come! We may see this trajectory continue to touch and break through 44.9158, unless it runs out of momentum and pulls back to current levels.
GBPJPY is trapped in a Channel Down formation, implying that a breakout is Imminent. This is a great trade-setup for both trend and swing traders. It is now approaching a resistance line that has been tested in the past. Divergence opportunists may be very optimistic about a possible breakout and this may be the start […]
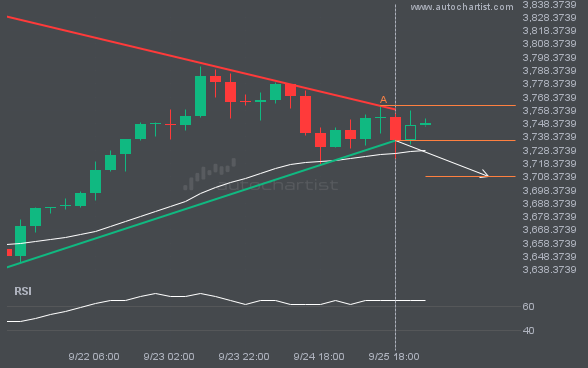
XAUUSD has broken through a support line of a Triangle chart pattern. If this breakout holds true, we may see the price of XAUUSD testing 3708.4812 within the next 23 hours. But don’t be so quick to trade, it has tested this line in the past, so you should confirm the breakout before taking any […]
FTSE100 is heading towards the resistance line of a Triangle and could reach this point within the next 3 days. It has tested this line numerous times in the past, and this time could be no different from the past, ending in a rebound instead of a breakout. If the breakout doesn’t happen, we could […]

