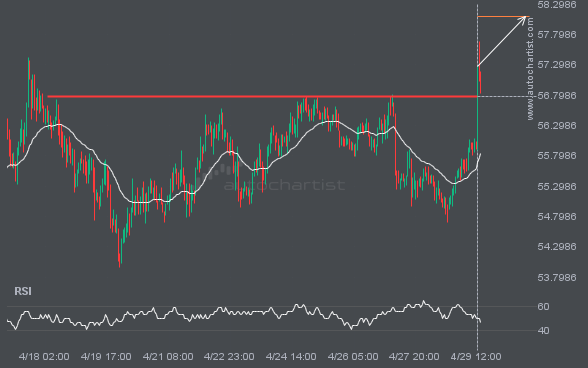
XAGUSD is trapped in a Falling Wedge formation, implying that a breakout is imminent. This is a strong trade setup for both trend and swing traders. It is now approaching a support line that has been tested before. Divergence watchers may be optimistic about a potential breakout, which could mark the start of a new […]
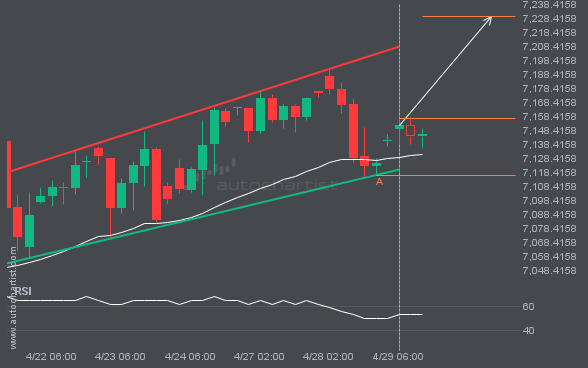
The movement of S&P500 toward the resistance line of a Channel Up is yet another test of the line it has reached numerous times in the past. This test of the line could occur within the next 2 days, but it is uncertain whether it will result in a breakout through this line or simply […]
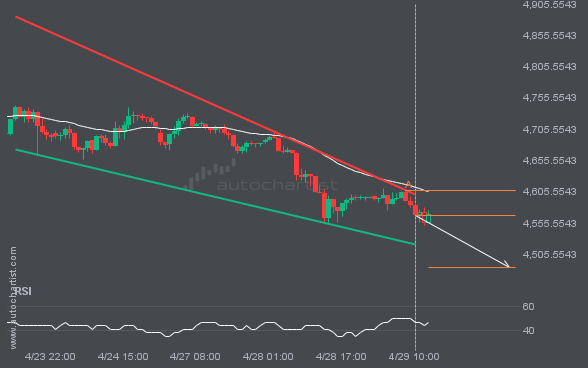
XAUUSD is moving toward a support line it has tested many times. It has retraced from this line before, so it’s unclear whether it will break through or rebound again. If XAUUSD continues on its current trajectory, it could reach 4485.0545 within the next 2 days.
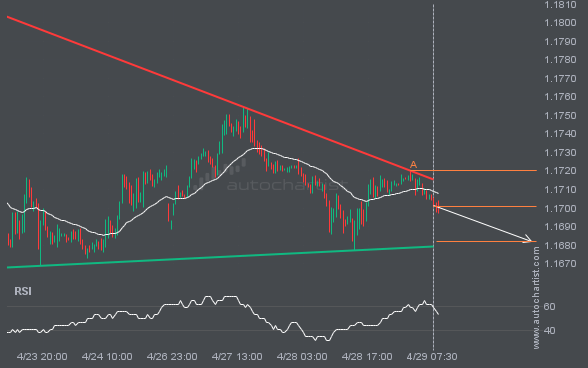
EURUSD is moving toward a support line. Since it has retraced from this line before, we may see either a breakout through this line or a rebound to current levels. It has touched this line numerous times in the last 8 days and may test it again within the next 2 days.
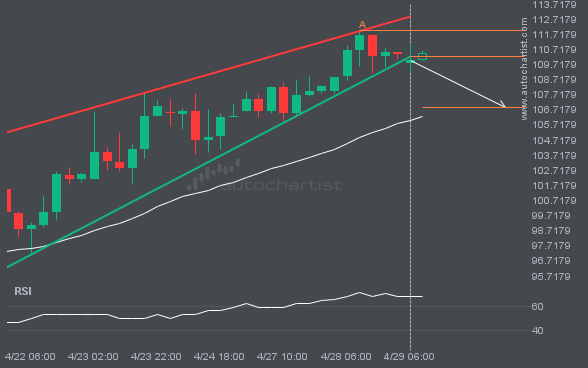
BRN/USD has moved through the support line of a Rising Wedge pattern at 110.23942857142858 on the 4 hour chart. This line has been tested multiple times in the past, and this breakout could signal an upcoming change in the current trend. Price may continue in the current direction toward 106.8749.
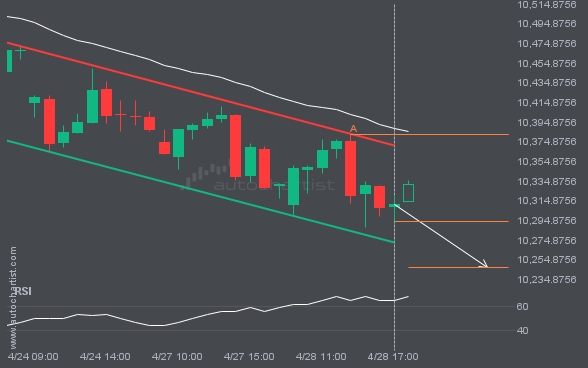
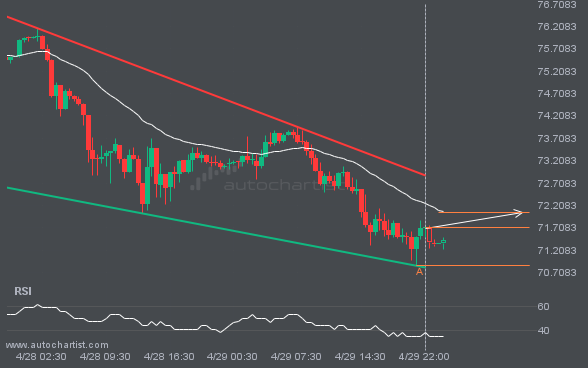
FTSE100 is heading toward the support line in a Channel Down pattern. If this move continues, the price of FTSE100 could test 10247.1785 within the next 7 hours. It has tested this line many times before, so the move could be short-lived and may rebound as it has before.
With increasing competition in the financial trading and fintech landscape, brokers need new ways to attract and retain clients and
A well-executed multi-channel content approach is essential to build brand awareness and trust for any company. But for this strategy to be successful, you need to tap into the right combination of channels with the right message to ensure you reach the correct people. Currently there are around 4.9 billion internet users worldwide, almost all of […]
There are more than 4.62 billion social media users worldwide, that is well over half the worlds population. What is more, this growing industry is also evolving. Not only is this industry growing, it is also changing. People are now using these networks for more than just engaging with friends. Today, social media platforms play […]
In a constantly evolving digital economy, you are bound to face new demands from your clients for innovative products and services. Traders trade at home, on the go, and on many devices using many strategies. They need versatility and fast execution, and to stand out to them you need flexibility and a wide range of […]
As geopolitical events grab the headlines, market volatility continues to soar. You only need to look at the CBOE Volatility Index which stood at 33.86 on March 10, 2022 to see the effect. Furthermore, oil price volatility is at historic high levels, and global stock markets have been subdued due to rising global tensions. Thanks […]
Congratulations! You have a new trader signed up for your demo account. However, this is only the first small step towards a new live trader. At this stage, most traders may be feeling sceptical or nervous about depositing funds into a live account with your broker, while others may still be wondering whether they have […]
Financial reporting is a crucial requirement for regulated brokers. However, creating and distributing unique content is extremely resource-intensive, leaving many brokers unsure whether it is worth the ROI. But what if brokers could access unique, actionable content at a fraction of the cost? There are several challenges brokers face when producing unique content for their […]