 Skip to content
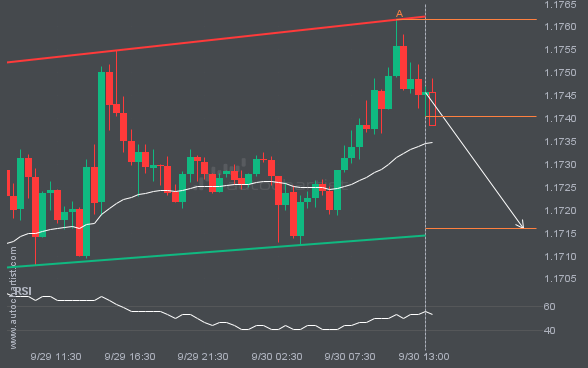
 The movement of EURUSD towards the support line of a Channel Up is yet another test of the line it reached numerous times in the past. This line test could happen in the next 8 hours, but it is uncertain whether it will result in a breakout through this line, or simply rebound back to […]
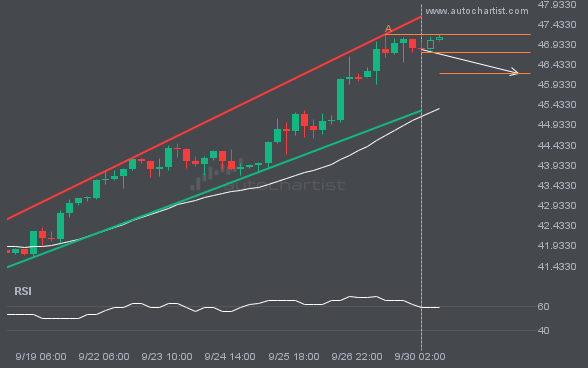
The movement of XAGUSD towards the support line of a Channel Up is yet another test of the line it reached numerous times in the past. This line test could happen in the next 2 days, but it is uncertain whether it will result in a breakout through this line, or simply rebound back to […]
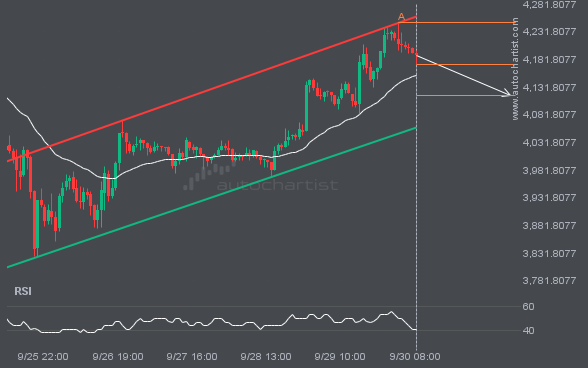
Emerging Channel Up pattern in its final wave was identified on the ETHUSD 1 hour chart. After a strong bearish run, we find ETHUSD heading towards the upper triangle line with a possible resistance at 4116.8918. If the support shows to hold, the Channel Up pattern suggests a rebound back towards current levels.
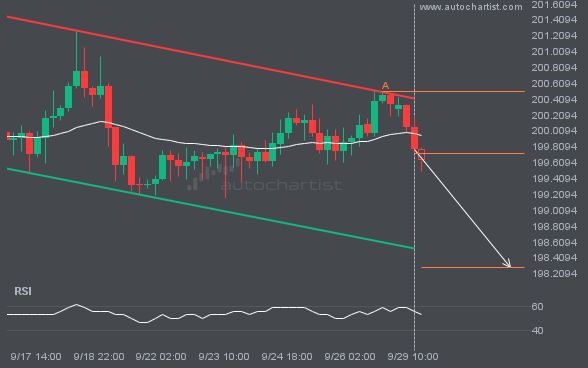
Emerging Channel Down detected on GBPJPY – the pattern is an emerging one and has not yet broken through resistance, but the price is expected to move up over the next few hours. The price at the time the pattern was found was 199.7315 and it is expected to move to 198.2898.
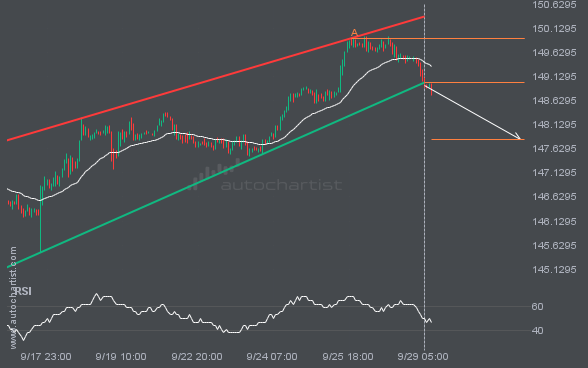
This trade setup on USDJPY is formed by a period of consolidation; a period in which the price primarily moves sideways before choosing a new direction for the longer term. Because of the bearish breakout through support, it seems to suggest that we could see the next price move to 147.8176.
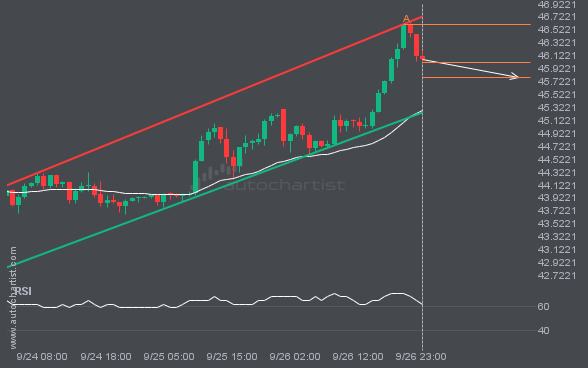
Emerging Channel Up pattern in its final wave was identified on the XAGUSD 1 hour chart. After a strong bearish run, we find XAGUSD heading towards the upper triangle line with a possible resistance at 45.7884. If the support shows to hold, the Channel Up pattern suggests a rebound back towards current levels.
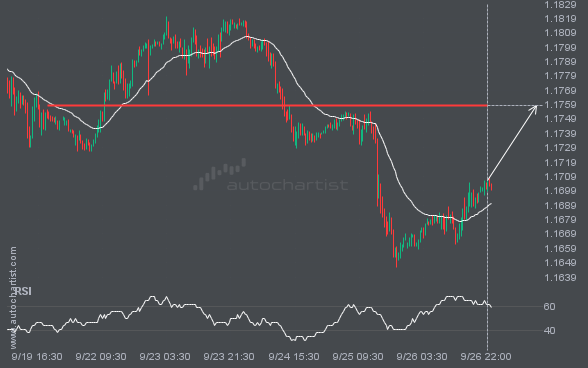
EURUSD is moving towards a line of 1.1758 which it has tested numerous times in the past. We have seen it retrace from this position in the past, so at this stage it isn’t clear whether it will breach this price or rebound as it did before. If EURUSD continues in its current trajectory, we […]

