Skip to content
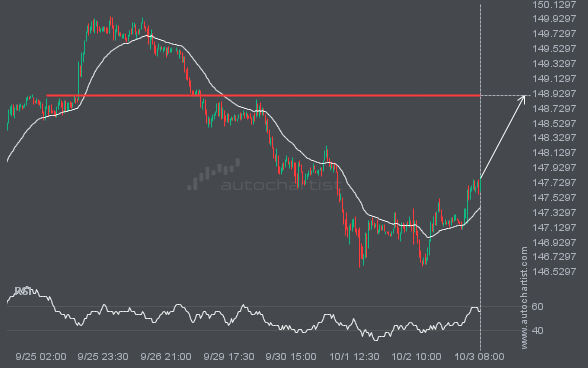
USDJPY is en route to a very important line that will be a definite deciding factor of what is to come! We may see this trajectory continue to touch and break through 148.8950, unless it runs out of momentum and pulls back to current levels.
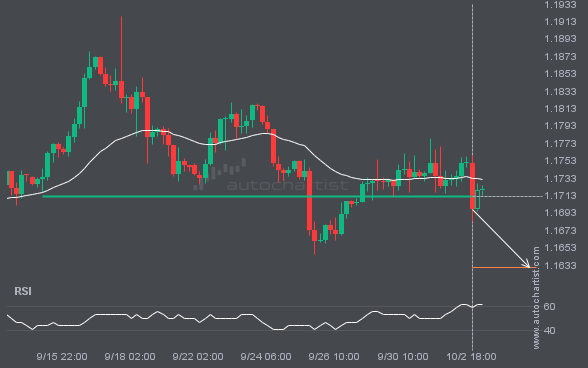
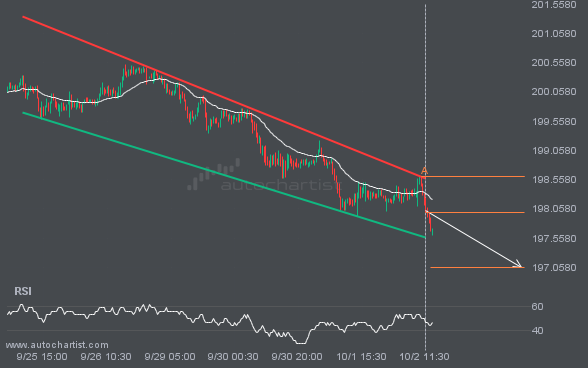
EURUSD has broken through a support line. Because we have seen it retrace from this price in the past, one should wait for confirmation of the breakout before trading. It has touched this line numerous times in the last 18 days and suggests a possible target level to be around 1.1630 within the next 4 […]
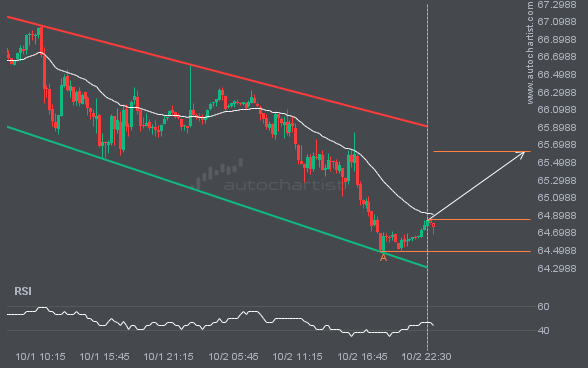
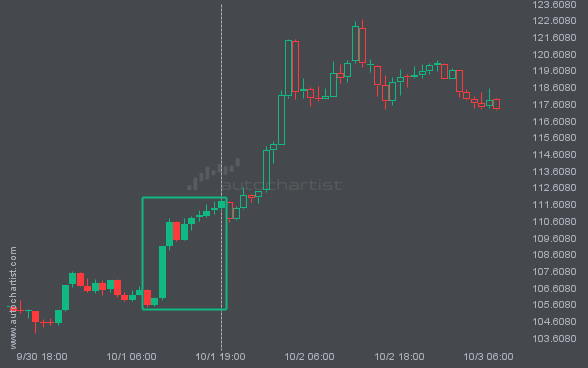
BRN/USD is heading towards the resistance line of a Channel Down and could reach this point within the next 10 hours. It has tested this line numerous times in the past, and this time could be no different from the past, ending in a rebound instead of a breakout. If the breakout doesn’t happen, we […]
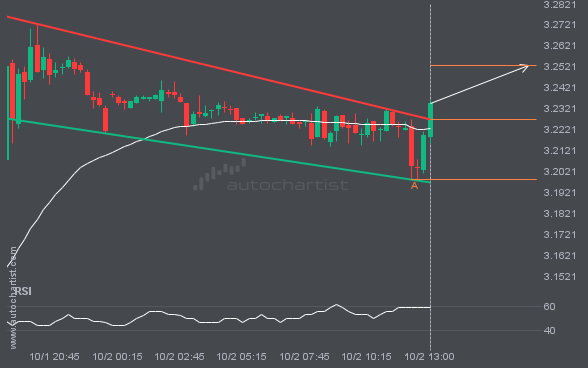
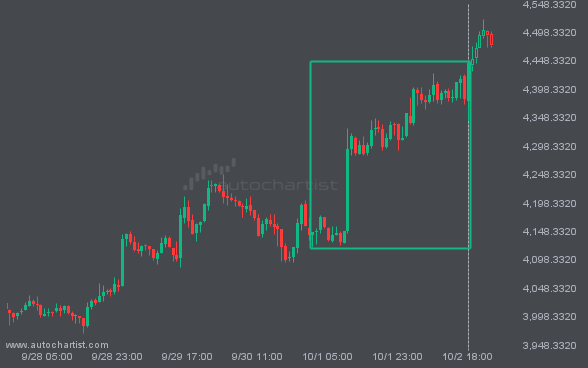
You would be well advised to confirm the breakout that has just occurred – do you believe the move through resistance to be significant? Do you have confirming indicators that the price momentum will continue? If so, look for a target of 3.2527 but consider reducing the size of your position as the price gets […]
The movement of GBPJPY towards the support line of a Channel Down is yet another test of the line it reached numerous times in the past. This line test could happen in the next 2 days, but it is uncertain whether it will result in a breakout through this line, or simply rebound back to […]