Skip to content
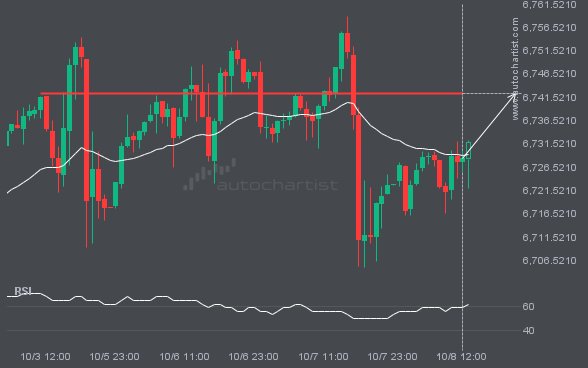
S&P500 is heading towards a line of 6742.4302. If this movement continues, the price of S&P500 could test 6742.4302 within the next 16 hours. But don’t be so quick to trade, it has tested this line numerous times in the past, so this movement could be short-lived and end up rebounding.
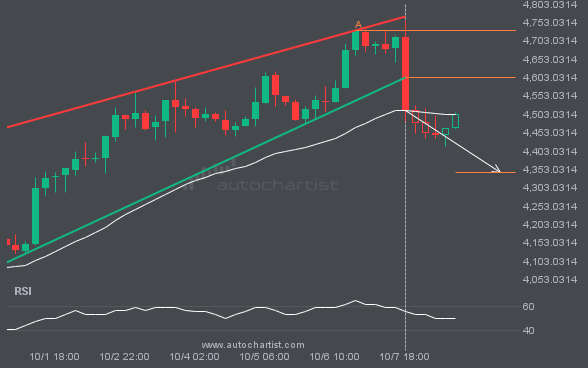
Rising Wedge pattern identified on ETHUSD has broken through a support level with the price momentum continuing to move in an downward direction. A solid trading opportunity continues with the price expected to reach 4345.3579 in the next 2.
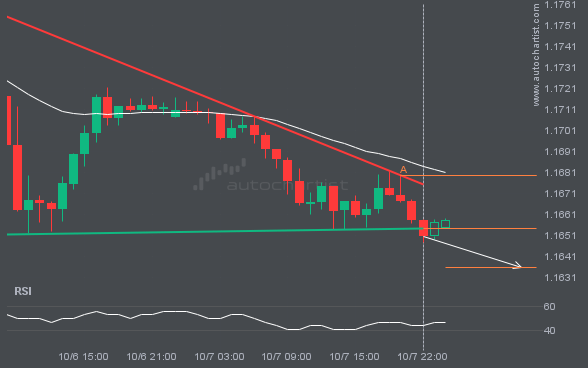
This trade setup on EURUSD is formed by a period of consolidation; a period in which the price primarily moves sideways before choosing a new direction for the longer term. Because of the bearish breakout through support, it seems to suggest that we could see the next price move to 1.1636.
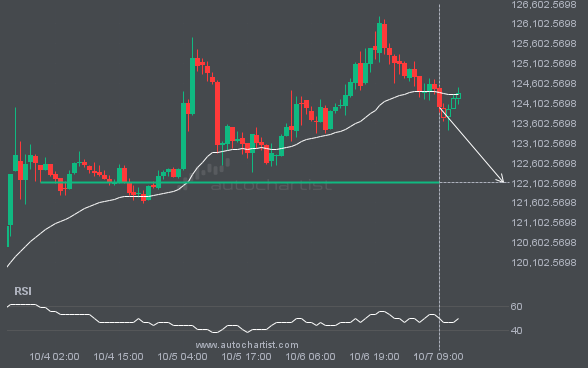
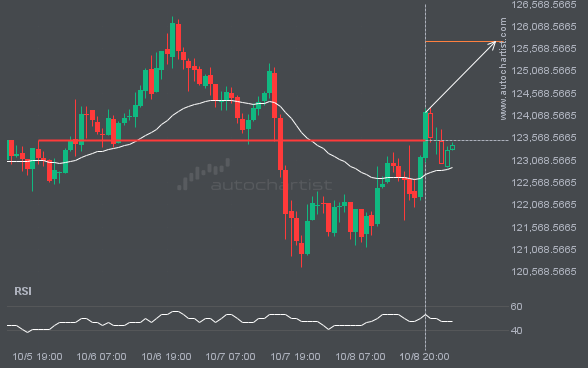
BTCUSD is about to retest a key horizontal support level near 122113.6172. It has tested this level 4 times in the recent past and could simply bounce off like it did last time. However, after this many tries, maybe it’s ready to start a new trend.