Skip to content
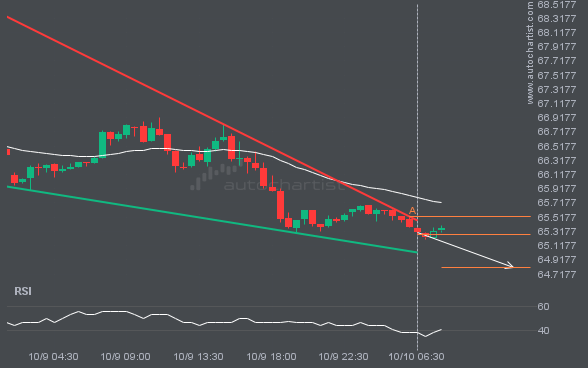
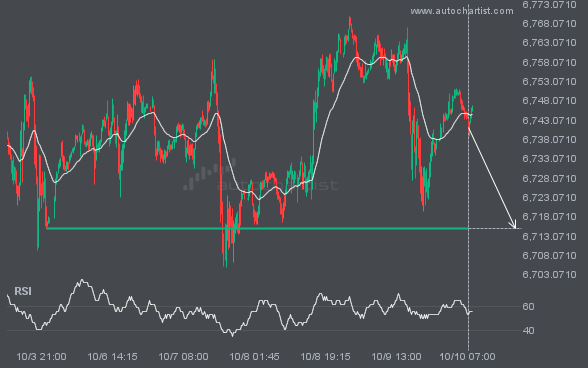
BRN/USD is moving towards a support line. Because we have seen it retrace from this line before, we could see either a break through this line, or a rebound back to current levels. It has touched this line numerous times in the last 2 days and may test it again within the next 6 hours.

GBPJPY is moving towards a resistance line. Because we have seen it retrace from this line before, we could see either a break through this line, or a rebound back to current levels. It has touched this line numerous times in the last 23 hours and may test it again within the next 5 hours.
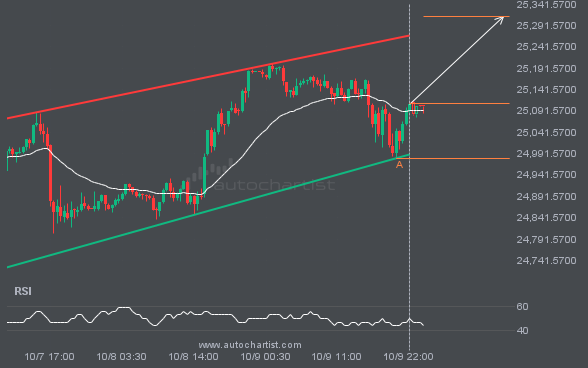
An emerging Channel Up has been detected on NAS100 on the 30 Minutes chart. There is a possible move towards 25312.2104 next few candles. Once reaching support it may continue its bullish run or reverse back to current price levels.
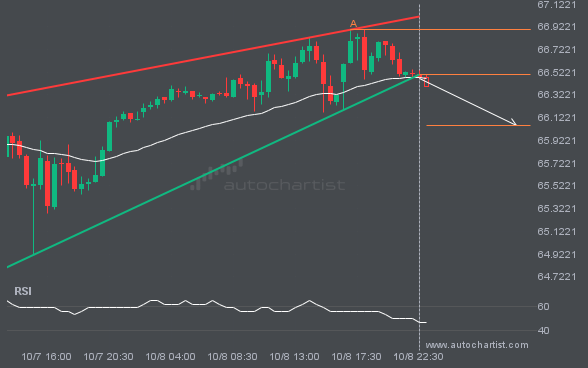
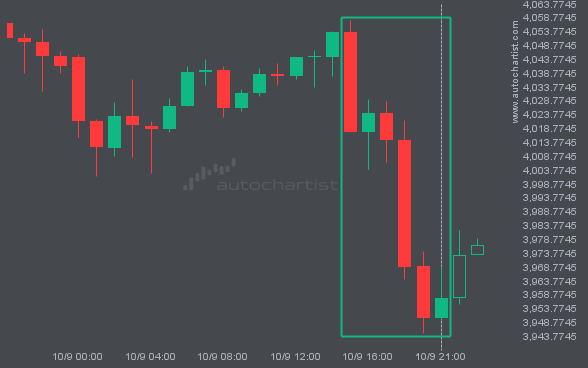
This trade setup on BRN/USD is formed by a period of consolidation; a period in which the price primarily moves sideways before choosing a new direction for the longer term. Because of the bearish breakout through support, it seems to suggest that we could see the next price move to 66.0546.
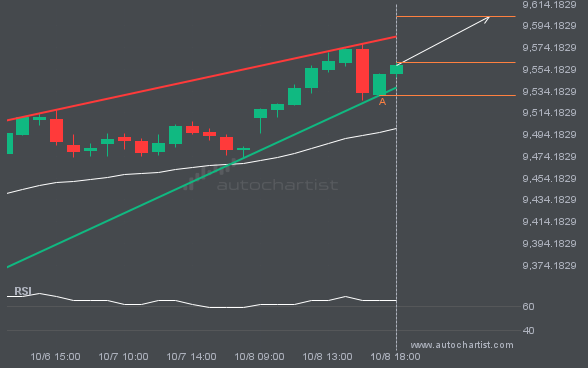
An emerging Rising Wedge has been detected on FTSE100 on the 1 hour chart. There is a possible move towards 9602.6588 next few candles. Once reaching support it may continue its bullish run or reverse back to current price levels.